- Home
- Blog
- Forecast and Price Predictions
- Oil Forecast and Price Predictions 2026: Decline to continue
Oil Forecast and Price Predictions 2026: Decline to continue

In 2025, crude oil prices exhibited significant volatility but trended downward overall, with Brent crude averaging around $68-70 per barrel and WTI around $65 per barrel, marking a decline of over 20% from 2024 highs (the most since 2020) amid persistent supply outpacing demand.
The global oil market is likely to remain under pressure in 2026 as well, due to rising supply and weak demand, which are curbing prices. Traders monitor OPEC+ for policy signals and any attempts to bolster the market.
OPEC is set to hold production in Q1 2026, projecting a balanced outlook between supply and demand, while the IEA projects a surplus of nearly 4 million barrels per day. While geopolitics remains a consistently uncertain element between sanction escalations, tariffs, and peace-deal supply risks, the latest oil price forecast for 2026 suggests slightly lower prices with less volatility.
Oil Forecast & Price Predictions – Summary
- Oil price prediction Q1 2026: Holding production steady through Q1 2026 helps limit near-term volatility and provides some support to prices, but it does not materially alter the underlying surplus. The Brent crude oil spot price is forecasted to average below $60 per barrel in Q1.
- Oil price prediction 2026: The EIA forecasts the Brent crude oil price will average $56 per barrel (b) in 2026, 19% less than in 2025.
- Oil price prediction for the next 5 years and beyond: The EIA projects global fossil fuel demand will peak by 2030, with Brent prices now expected to decline toward roughly $54/bbl by 2027 under current policies. Long-term forecasts remain divided, though accelerating energy transitions and EV adoption create sustained downward pressure beyond 2030.
With NAGA.com, you can trade US Oil Spot and UK Oil Spot futures through CFDs if you want to speculate on price movements and trade or invest in Oil stocks and Oil ETFs.
Crude Oil Forecast 2026 – Fundamental Analysis
Oil continues to dominate the energy markets, yet the fundamentals point to a bearish picture in 2026. Those forecasting rising crude prices face an uphill battle against overwhelming evidence to the contrary.
The geopolitical tensions that once fueled a "fear premium" for oil through 2024 and into early 2025 have dissipated significantly. Meanwhile, supply expansion continues and broadens beyond traditional sources like OPEC and U.S. shale. Emerging leaders—now dubbed the Atlantic Basin Triad of the United States, Brazil, and Guyana—are driving much of the growth, reshaping the global oil production landscape.
According to the U.S. Energy Information Administration, Brazil and Guyana will account for nearly half of the forecasted worldwide oil production increases in 2026, with Guyana's offshore projects achieving record ramp-up speeds and Brazil's pre-salt reservoirs surpassing projections. The International Energy Agency forecasts a substantial global surplus of nearly four million barrels per day next year, even after recent downward adjustments, signalling unusually high stockpiles.
On the demand side, momentum is waning, particularly in China, where aggressive adoption of electric vehicles signals a lasting decline in oil needs. Without a dramatic geopolitical disruption, Brent crude faces challenges staying above $60 per barrel in 2026.
For investors, these dynamics shift priorities: the era of quick profits from pure exploration and production plays appears over. In a sub-$60 oil environment, smaller shale operators will see margins shrink rapidly, favouring integrated oil majors with robust finances, varied income sources, and the capacity to snap up undervalued assets while sustaining shareholder payouts.
Global oil production forecast
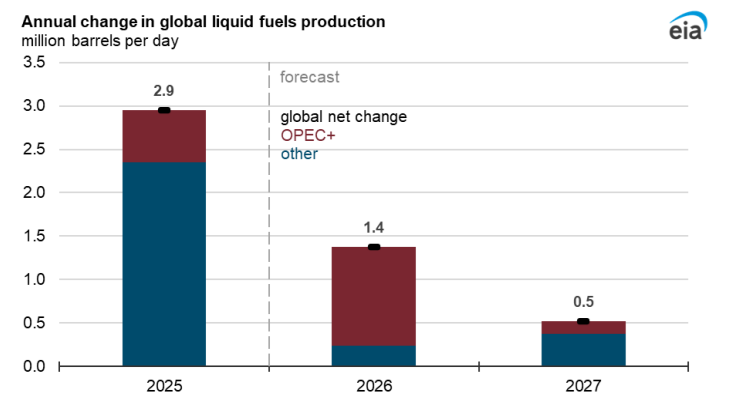
Oil production growth is forecast to slow over the next two years following 2025's 2.9 million b/d increase. According to EIA, in 2026, global liquid fuels production rises by 1.4 million b/d, driven by OPEC+ and non-OPEC+ output, mainly from South America. By 2027, growth drops to 0.5 million b/d, coming almost entirely from non-OPEC+ countries as OPEC+ production stays flat.
Past performance is not a reliable indicator of future results. All historical data, including but not limited to returns, volatility, and other performance metrics, should not be construed as a guarantee of future performance.
Brazil, Guyana, and Argentina lead with a 0.6 million b/d rise in 2026 outside OPEC+, while OPEC+ adds 1.1 million b/d excluding Iran, Libya, and Venezuela. Venezuela's production drop offsets some gains this year, as seen in EIA’s crude oil outlook for 2026. In 2027, these South American nations grow by 0.4 million b/d—two-thirds of the global total—countering a 0.2 million b/d U.S. crude decline from lower prices.
Global oil consumption forecast
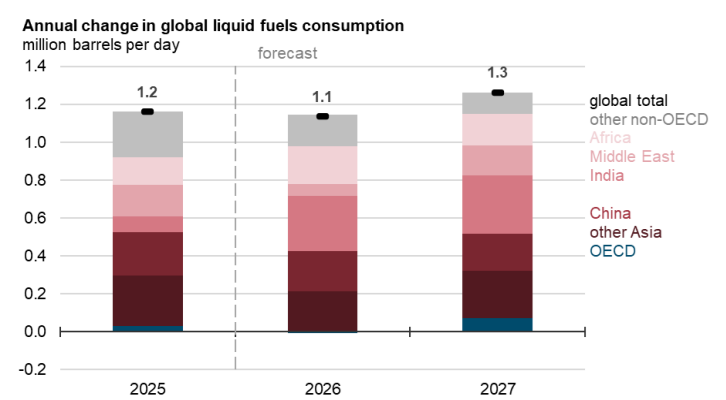
Global liquid fuels consumption rose by 1.2 million b/d in 2025, expected to grow by 1.1 million b/d in 2026 and 1.3 million b/d in 2027. Growth accelerates next year with stronger global economic activity. Forecasts from Oxford Economics project GDP expansion of 3.1% this year and 3.3% in 2027.
Past performance is not a reliable indicator of future results. All historical data, including but not limited to returns, volatility, and other performance metrics, should not be construed as a guarantee of future performance.
Non-OECD countries drive nearly all increases, with 1.1 million b/d in 2026 and 1.2 million b/d in 2027, concentrated in Asia. India leads with nearly 0.3 million b/d growth in both years, while China adds just over 0.2 million b/d annually. The Middle East contributes 0.1-0.2 million b/d, and Africa sees 0.1-0.2 million b/d, led by Sub-Saharan gains.
How to Trade and Invest in Oil
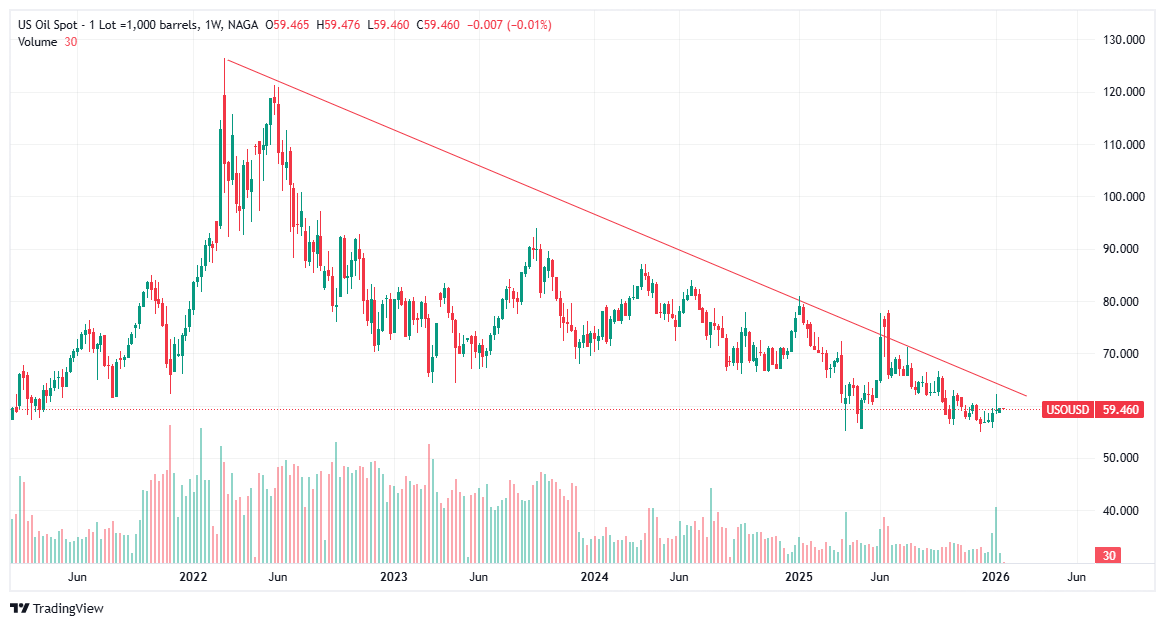
Oil Prices Forecast 2026 – Technical Analysis
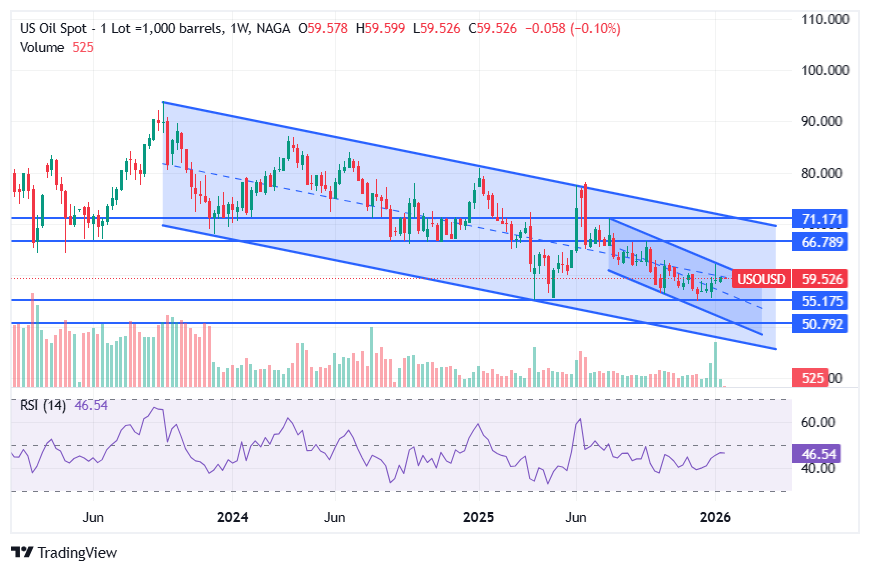
From a technical chart pattern perspective, both Brent and WTI Oil have been locked in a consistent descending channel since late 2023, confirming a structurally bearish trend. Each rebound has failed at lower highs, while support levels continue to give way, reinforcing the idea that bears remain in control.
Momentum indicators reflect this grind lower rather than capitulation: the RSI indicator has repeatedly struggled to sustain moves above neutral levels, signalling weak upside conviction rather than oversold exhaustion.
As long as prices remain capped within these downward channels, rallies are likely to be corrective rather than trend-changing, keeping the broader bias tilted toward further downside into 2026 unless a clear break in structure emerges.
Crude Oil Outlook 2026
Crude Oil has been trending within a downward-sloping parallel channel since mid-2025, which itself lies within an even broader downtrend dating back to 2023.
Past performance is not a reliable indicator of future results. All historical data, including but not limited to returns, volatility, and other performance metrics, should not be construed as a guarantee of future performance.
This multi-layered structure reinforces a broader bearish bias and establishes the key levels crude must be clear to transition from short-term fluctuations toward a more constructive long-term outlook.
Resistance levels
• 60.50 – Key upside breakout level that crude has been attempting to hold.
• 62.60 – Next major resistance aligned with the upper boundary of the seven-month channel.
• 65 - 66.40 → 68 – A confirmed weekly close above 62.60 could open a path toward the two-year channel boundary at 66.40, then 68, marking early confirmation of a longer-term bullish reversal structure should the trend hold above the channel bounds and 70 psychological level.
Support levels
• 55.00 (7-month channel) → 49.00 – A confirmed close below 55 would expose the long-term channel boundary at 49, offering another potential long-term buy-the-dip opportunity.
Crude’s broader structure is leaning toward a potential double-bottom reversal, in line with exporter breakeven price risks, either from the 55 low or the deeper 49 low from the lower 2-year channel border. However, as long as the price remains within the descending channel established since 2023, the bearish oil outlook remains intact.
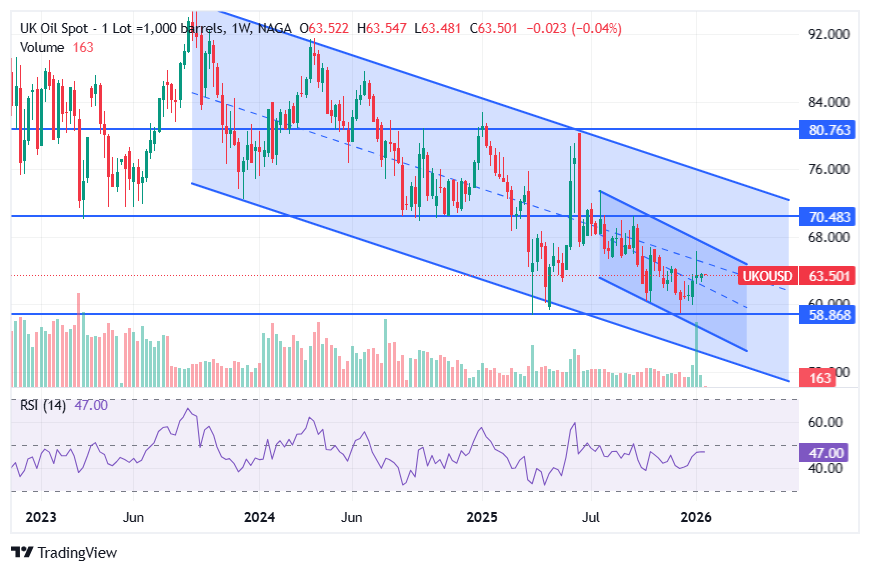
Brent Oil Outlook 2026
Brent oil price action is challenging the mid-range of a parallel channel started in December 2023. Despite remaining in a two-year bearish bias, the short-term structure reflects a neutral-to-bearish hold, consistent with broader market behavior.
Past performance is not a reliable indicator of future results. All historical data, including but not limited to returns, volatility, and other performance metrics, should not be construed as a guarantee of future performance.
Resistance levels
A clean hold above 64.70 and 66.00 is expected to align gains with the upper channel boundary and the September 2025 highs near the 69–70 zone — the defining barrier between long-term bullish and bearish bias.
Support Levels
A clear trendline connecting higher lows from April through December 2025 defines the short-term bullish structure; however, price action risks a bearish breakout:
- A close below 59.00 would invalidate this trend, targeting 57.70 for a potential double-bottom setup with the yearly lows.
- Extended losses could drive price toward the lower channel boundary near 52.00, aligning with a possible USOIL decline toward 49 and its respective long-term support zone.
These structural levels remain the primary dividing lines between sustained bearish continuation and a long-awaited bullish transition.
The long-term Brent Oil outlook stands on crude’s overall history, despite a complex mix of geopolitical and macroeconomic drivers, where crude respects an up-trending channel seen on the 3-month time frame since the 1860’s, analyzed here to quantify the 2026 drawdown risks/buy-the-dip opportunities.
To learn more about technical analysis as a forecasting tool visit NAGA Academy.
Oil Brands
When talking about the commodity oil traded on financial markets, we can distinguish two types. The most popular and among the most traded is US Oil, also known as WTI (about $63/bbl in August 2025). The other popular variant is UK Oil, also known as Brent (a North Sea benchmark, about $66/bbl).
How to Trade and Invest in Oil
West Texas Intermediate (WTI)
Light sweet crude oil (WTI) is widely used in US refineries and is an important benchmark for oil prices, with recent trading around $65 per barrel (August 2025). WTI is a light oil with a high API gravity and low sulfur content. This expresses the density of the oil in relation to water. WTI oil is widely traded between oil companies and investors. Most trading is done through futures via CME Group (NYMEX). The Light Sweet Crude Oil (CL) future is one of the most traded futures worldwide and is physically delivered at Cushing, Oklahoma.
Much of the commercial storage and the delivery point for this grade is in Cushing, an important hub for Oklahoma's oil industry. Here is large storage tanks connected to pipelines that transport the oil to all United States regions. WTI is an important feedstock for refineries in the Midwestern United States and on the coast of the Gulf of Mexico.
Brent Crude Oil
Brent oil is an important benchmark for the petroleum rate, especially in Europe, Africa, and the Middle East. Its name is derived from the Brent oil field in the North Sea. This Royal Dutch Shell (now Shell plc) oil field was once one of Britain's most productive oil fields, and most of the platforms there have since been decommissioned.
The correlation between these two futures' price development is high, and we have seen several times in recent years that Brent's price was more than $10 higher than the comparable WTI contract during periods of market stress, while in 2025 the difference has generally been more moderate. At the end of 2020, the difference was approximately $3,00, and as of August 2025 it typically ranges around $2,00–$5,00, with Brent near $66 per barrel. Such differences are caused, among other things, by supply and demand, including the costs of shipping or storing oil.
Oil Price Prediction for 2026 and beyond (2030)
Oil price forecasts from major institutions show a mix of near-term softness and longer-term uncertainty. Agencies and institutional investors forecast Brent crude oil prices to average in the mid-$50s per barrel for 2026, driven by supply surpluses, rising inventories, and modest demand growth.
Looking toward 2030, projections diverge significantly. While Fitch Ratings and the EIA foresee prices stabilizing in the $60–$73 range due to oversupply and slower demand growth, other models suggest potential extremes. Energy consultancies warn prices could either collapse toward $40 with accelerated renewable adoption or surge past $100 if emission targets stall, though these outcomes are framed as scenario risks rather than central cases. Common themes across forecasts include the growing impact of energy transition policies, non-OPEC+ production growth, (notably in the U.S. and Brazil), and demand uncertainties from evolving tariff landscapes.
Here are the most important oil price predictions released or updated by some of the most influential financial institutions in the world today:
EIA’s Forecast 2026: Decline to continue
The U.S. Energy Information Administration (EIA) now forecasts Brent oil to average $56/bbl and WTI oil around $52/bbl. EIA forecasts that growing global oil production will continue to drive high global oil inventory builds through the forecast, causing crude oil prices to fall through 2026. However, inventory builds begin to gradually moderate next year, stemming price declines.
Goldman Sachs' Oil Forecast 2026-2028
Goldman Sachs projects Brent at $56/bbl late 2026 (within $60-70 range), driven by high inventories, completed OPEC+ project restarts, and non-OPEC growth overwhelming demand. They highlight a 2 mb/d surplus risk, and advise short positions on oil amid bearish fundamentals, though recovery to $76/bbl by 2028 could follow if rebalancing occurs. Exporter breakeven pressures and ample spare capacity reinforce the downside bias.
Fitch Ratings' neutral oil price forecast
Fitch Ratings forecasts Brent at $65/bbl for 2026, reflecting oversupply from OPEC+ restorations and slowing global consumption growth amid energy transitions. Non-OPEC+ gains from U.S. shale and Brazil offset modest demand upticks, leading to persistent surpluses; downside risks include faster renewables adoption or tariff impacts. This view holds slightly above peers despite bearish inventory trends.
J.P. Morgan’s bearish oil price forecast for 2026
J.P. Morgan maintains its Brent crude forecast at $58/bbl for 2026, with WTI at $54/bbl, citing supply outpacing demand as non-OPEC+ producers like the U.S. and Brazil add significant output while OPEC+ continues unwinding cuts. Global demand grows modestly at 0.9 million bpd, but supply expansion—three times faster—creates surpluses and inventory builds, keeping prices under pressure despite brief geopolitical spikes. The bank warns of tail risks like a market reset into the $30s by 2027 if oversupply persists without OPEC+ response.
Reuters poll
The survey of 34 economists and analysts conducted in December forecast that Brent crude would average $61.27 per barrel in 2026, down from November's forecast of $62.23. U.S. crude is projected to average $58.15 per barrel, below November's estimate of $59.00.
The highest forecast in the poll is from analysts at DBS Bank, who expect Brent crude to average $68 next year, as an OPEC+ pause and possible new sanctions on Russia could support prices. ABN Amro and Capital Economics have the lowest Brent crude price forecast for 2026 at $55 per barrel, as per the poll.
Algorithm-based (AI) Oil Price Forecasts
Oil forecasts for 2026 project Brent averaging around $56 per barrel, according to the latest EIA STEO models released in January 2026, amid persistent global inventory builds and supply outpacing demand. WTI is expected to average near $51-52/bbl, reflecting a typical $4-5 discount to Brent, with quarterly lows around $50 in Q1, before slight stabilization later in the year.
Long Forecast anticipates that WTI crude will fluctuate around 62,80 bbl in 2026, with a high at 66.20 in March. Brent oil is now projected to reach a 72.5 high in February and close the year at 69 bbl.
McKinsey's 2040 equilibrium model maintains its long-term oil price forecast in the $50–60/bbl range, driven by flattened production cost curves and ongoing pressures from the energy transition. OPEC upholds bullish demand projections, now forecasting global oil demand growth of 1.4 million b/d in 2026 alongside total demand reaching about 106.5 million b/d, fuelled by emerging market expansion in regions like China, India, and Latin America.
Structural shifts emerge in price drivers:
- US sanctions on Russian energy exports may continue to intensify in 2026, targeting major producers like Gazprom Neft and Surgutneftegas along with their shadow fleet of over 180 vessels, though global supply growth has mitigated prior 1.2mn bpd risks.
- Energy transition dynamics now project Brent prices capped at $65-75 through 2035 amid slower EV adoption and persistent demand from Asia.
- OPEC+ fully restored its 2.2mn bpd cuts by late 2025, leading to inventory builds and sub-$55 scenarios through mid-2026, with forecasts converging on mid-$50s by Q1 2026.
OPEC+ unwinding spurred Brent declines to $67/bbl by late 2025, with 2026 projections at 1.9mn bpd global supply growth outpacing 700kbpd demand rises. McKinsey updates emphasize post-2035 replacement needs for aging fields despite renewables, but non-OPEC+ slowdowns post-2027 support no lower than $55-65/bbl floor through 2040. Weak China and major economy demand tempers upside.
When looking for oil-price predictions, it's important to remember that analysts' forecasts may be wrong. This is because their projections are based on a fundamental and technical study of WTI and Brent oil commodities’ historical price movements. But past performance and forecasts are not reliable indicators of future results.
The AI oil price forecast shown is generated using algorithmic and AI-based models. These models rely on historical data and assumptions, which may not capture future market conditions accurately. Outcomes may differ significantly from forecasts.
It is essential to do your research and always remember that your decision to trade depends on your attitude to risk, your expertise in the market, the spread of your investment portfolio, and how comfortable you feel about losing money. You should never invest money that you cannot afford to lose.
How did the price of crude oil change over time?
Below is a chart of Brent Crude Oil, one can clearly see the descending trendline and the well-respected 70$ price barrier that has recently been broken.
Past performance is not a reliable indicator of future results. All historical data, including but not limited to returns, volatility, and other performance metrics, should not be construed as a guarantee of future performance.
A Recent History of Oil
At the end of April 2020 (due to the Saudi and Russia conflict - more on that later), the oil price crashed, and the May WTI future even dipped below $0. The stock markets recovered strongly during the summer, and the oil price had also found its way up again. In August, the oil price rose well above $ 40 a barrel. With that price, the largest oil companies got some air also, but it was still far from enough for most to make a profit.
At the beginning of August 2025, the oil price had suddenly fallen hard again. Simultaneously with renewed risk-off in the US stock markets, a crude oil barrel’s worth slid by roughly 10–15% from early-summer levels to the low-to-mid $60s, with WTI around $63 a barrel and Brent near $ 66 a barrel. This pushed prices back toward the lower end of the recent range. The drop is partly because OPEC+ accelerated the unwinding of earlier production cuts and because global supply is now rising faster than demand, alongside concerns about large inventory builds in the months ahead.
The current imbalance between rising supply and slower demand growth could thwart a smoother market rebalancing and decrease refining margins. With several refineries trimming runs again, it seems they want to prevent oil stocks from rising back to record levels, yet inventories have still been building. The oil price was able to recover so strongly in recent years thanks to the OPEC+ countries' agreements regarding the reduction in production, but these curbs are now being rolled back more quickly than initially planned. However, with budgets under pressure, many countries are looking for additional income sources. Therefore, some countries are not fully complying with the agreements made, and U.S. crude output has hovered near record highs as well. As a result, more oil flows into the market, which also has a depressing effect on oil prices.
March 9th, 2020: 30% Oil Price Crash
Monday, March 9th, entered the history books as "Black Monday" for the oil price, with Brent crude plunging roughly 30% in its biggest one-day fall since the Gulf War. Negotiations between Saudi Arabia and Russia had come to nothing, setting off a price war on top of the mounting COVID-19 shock.
The oil price had already been under pressure in the previous months due to the spread of the coronavirus (COVID-19). The world economy was on the back burner, and as a result, the oil demand had declined considerably. By limiting oil production, the countries that are part of the oil cartel hoped to stabilize or increase the price themselves. Saudi Arabia, in particular, had been strongly in favour of limiting oil production within OPEC+.
Saudi Arabia then tried to force Russia in another way to join the OPEC plan. The Saudis announced steep price discounts and moved to increase production markedly—to as much as 12.3 million barrels per day from about 9.7 million—flooding the market with oil. As a result, Brent opened more than 30% lower on March 9 while WTI fell about 20%, taking prices to their lowest levels since 2016 and triggering market turmoil worldwide. A low oil price is disastrous for most countries, and most OPEC members remained heavily reliant on hydrocarbon revenues despite early diversification efforts. In the immediate aftermath, prices and equities staged a brief rebound the next day, but volatility persisted until OPEC+ ultimately returned to coordinated cuts in April 2020.
America's shale producers were indeed hit hardest in 2020. The shale revolution proved more and more to be built on quicksand, as costs stayed high and many new wells delivered steeper decline curves. Even with an oil price of around $60 a barrel, many of these producers had already been struggling. The unrest surrounding the coronavirus made it difficult to raise external capital, and a wave of bankruptcies and consolidations followed. With Saudi Arabia pushing the oil price further down at the time, the situation became untenable for many producers, although survivors later adapted through efficiency gains and hedging. Players with a fragile balance and relatively high costs largely did not make it, and the sector that remained grew more disciplined as prices recovered and OPEC+ managed supply through intermittent quota adjustments. What Saudi Arabia failed to achieve in 2016 ultimately happened in 2020: Russia returned to the table, OPEC+ agreed to historic production cuts in April, and the market has since oscillated but recovered into the mid-2020s.
April 21st, 2020: WTI Goes Below Zero
In April 2020, we saw a situation in the oil markets that had never occurred before. The West Texas Intermediate Crude Oil (WTI) futures contract for May fell more than 100%. On April 20, the price fell during the day and took an unprecedented dive later in the day to $37.63/barrel, meaning that sellers were effectively paying buyers to collect the oil.
This was mainly because storage capacity in Cushing, Oklahoma was near full. And it is precisely there that this oil is delivered. Traders and large companies who were long at the time but ran out of storage capacity or liquidity were forced to close futures before expiry, and since then there has been no repeat of negative prices as exchanges and regulators tightened risk controls, margining, and delivery protocols around expiry.
Shale Oil Influence
Oil production increased rapidly, and OPEC was not happy about this. They saw the surge in U.S. shale supply as competition. OPEC, therefore, came up with the idea of fully opening the oil taps by refusing to cut output in late 2014. The production costs of shale oil were at that time many times higher. The result was a drop in oil prices from about $110 a barrel to below $30 at the beginning of 2016. OPEC hoped to wipe out shale producers in this way.
This strategy failed, and the OPEC countries themselves ultimately suffered considerable disadvantages from this strategy. For years they saw their income more than halved and later resorted to OPEC+ production cuts that were unwound in stages starting in 2025. In the meantime, the shale producers have learned to work more efficiently, and they are already profitable at a lower oil price. What’s typical of this form of oil extraction is that production can be increased quickly, even though by 2025 the era of explosive growth has passed, and U.S. shale output is roughly flat to slightly lower while OPEC+ raises supply into a $75–$85 market.
OPEC Influence
Demand for oil has remained broadly stable in recent years. But it is also apparent that there is a lot of extra supply on the market now that American oil production is at historically high levels, even if the pace of growth has moderated. Shale oil, in particular, is extracted from the ground here. The shale revolution was set in motion in the late 2000s and accelerated by the sharp rise in oil prices in the early 2010s. This form of oil extraction was therefore profitable, despite the high production costs, and efficiency gains have since lowered break-even levels. Due to the attractive market, the oil companies sprang up like mushrooms, although investment has become more disciplined since 2020.
OPEC is trying to manage production to keep the oil price at a reasonable level. Most countries benefit from a somewhat higher, but in any case, stable, oil price. According to OPEC, the oil industry must invest more than $11,000 billion over the next 20 years. If producers don't do that, there will be a shortage. In principle, shale farmers can respond quickly to price signals, but have not invested enough in recent years to absorb a large part of these potential shortages on their own.
Furthermore, OPEC states that demand continues to increase despite the emergence of electric cars and the like. OPEC writes that the massive expansion of air travel and petrochemicals creates a greater demand for oil than the emergence of alternative energy sources can diminish, although the growth rate is slowing.
Since the low oil price in 2016, OPEC has been trying to support the oil price. This is done by agreeing on production adjustments with all countries that are members of OPEC and their partners in OPEC+, with cuts in earlier years and, in mid-2025, increases in output as inventories fell and demand held up. The agreements do not always go smoothly, as Iran and Iraq do not always adhere to these agreements. On the other hand, the US and other countries continue to produce large volumes of oil, keeping prices under pressure at times, while policy shifts and geopolitical tensions have also made prices more volatile for a long time.
Factors That May Affect the Price of Crude Oil
We know that oil is an indispensable raw material in the world and that it is used both as raw material and fuel to make plastics, pharmaceuticals, and many other products. Hence, the demand for oil remains strong though and these industries increases while production stagnates, it will lead to higher prices for this commodity. Of course, and vice versa, if these industries are in a recession, their oil demand will be lower, so demand will decline. If production remains stable or increases in this case, it will logically lead to a drop in the price of a crude oil barrel. This is precisely what has characterized much of 2025 so far: global supply growth has outpaced demand growth, commercial inventories have been building, and benchmark prices such as Brent have generally traded below $70 per barrel, with many outlooks for 2026 near the high‑$50s if stocks continue to rise.
As you will have understood, it is mainly by analysing the difference between supply and demand that you will determine how the price of crude oil will evolve.
It should also be noted that this analysis is slightly more complex today than it used to be. Until a few years ago, it was pretty easy to understand how these prices would behave. At the time, the US was the largest consumer of crude oil. On the other hand, OPEC was the main supplier to the market in terms of production. But over time and the years, this situation has become more complex and slightly more confusing. The United States is not only a top consumer but also the world’s largest producer as of 2025, while OPEC’s influence is now exercised through OPEC+ policy decisions alongside growing supply from non‑OPEC producers.
One explanation for this phenomenon is that oil drilling technologies have improved greatly and resulted in better supply, notably through U.S. shale and deepwater developments, with new capacity added in several countries. Besides, we have seen the emergence of alternative solutions on the demand side through electrification and renewable energy, which are beginning to temper long‑term oil demand growth even though oil remains dominant in the near term. Finally, new players have also joined, including China, still a major oil consumer in the world, and India, whose rising consumption has become increasingly important for global demand trends.
Below we have listed factors that change the supply or demand for oil and thus contribute to the evolution of this commodity's price.
1. Production data in barrels per day from OPEC countries
Too much production generally leads to lower oil prices per barrel and vice versa. US crude oil inventory data is published weekly, which also affects WTI.
2. Supply, which is published weekly on the economic calendar.
Big supply also contributes to falling prices, while little supply leads to higher prices.
3. The international geopolitical situation
Conflicts affecting the oil-producing and exporting countries often influence the development of the price per barrel.
4. The value of the US dollar on the currency market.
As a barrel of oil is denominated in dollars, this currency will be weaker, and more oil purchases will be stimulated by holders of other currencies.
Final words
Make sure to create a free demo account on NAGA.com, which remains a useful multi-asset platform for both novice and expert traders. You will be up to date on data and market insights, and the user-friendly interface—with TradingView integration—will come in handy if you decide to trade crude oil or any other commodity.
If you look at the price changes of oil for a while now, you may see patterns, but they are driven by unpredictable forces—geopolitics, OPEC moves, and economic cycles—so as an investor, respond with care.
If you want to invest in oil, it can seem smart to get in when the price hits a bottom, but this timing approach is speculative and risky. There is no guarantee that oil prices will match past highs, and the energy transition and policy shifts still shape long‑term demand. Oil is finite and important, but it is not uniquely “the most precious” and its role is changing as renewables and EVs expand. Investing in commodities can diversify your overall portfolio, though they are volatile and diversification does not guarantee profits or protect against losses.
Sources:
- https://www.opec.org/opec_web/en/publications/338.htm
- https://www.iea.org/reports/oil-market-report-august-2025
- https://www.eia.gov/outlooks/steo/pdf/steo_full.pdf
- https://www.fitchratings.com/research/corporate-finance/fitch-ratings-changes-global-oil-gas-sector-outlook-to-deteriorating-11-06-2025
Other resources:
- Gold forecast & price predictions 2026
- EURUSD forecast & price predictions 2026
- Dow Jones forecast & price predictions 2026
- Natural Gas forecast & price predictions 2026
- Turkish Lira forecast & price predictions 2026
- Silver forecast & price predictions 2026
- NASDAQ 100 forecast & price predictions 2026
- British Pound forecast & price predictions 2026
- USD to INR forecast & price predictions 2026
- Egyptian Pound forecast & price predictions 2026


The present domain / website, NAGA.eu is owned by Naga Technology GmbH, however is independently and exclusively operated by Axon Securities S.A., an AEPEY which is authorised and regulated by the Hellenic Capital Market Commission (HCMC) under licence No. 7/560/02.09.2010 and with registered address 48 Stadiou Street, 105 64 Athens, Greece.
NAGA is a trade name and trademark under the NAGA Group AG, a German based FinTech company publicly listed on the Frankfurt Stock Exchange | WKN: A161NR | ISIN: DE000A161NR7. Exclusive rights for the use of the said trade name and trademark, in the territory of Greece, are exclusively granted to Axon Securities S.A. In this respect and for the avoidance of doubt, any references in the present domain to "NAGA" refer just to the brand/trade name/trademark, the NAGA Platform or account and not to any specific company under NAGA Group of companies.
RESTRICTED JURISDICTIONS:With regards to the current website, Axon Securities S.A. offers services to Greek residents. Axon Securities S.A does not provide investment and ancillary services in the territories of third countries including Japan, Canada and the USA. For further details please refer to our Terms & Conditions.
HIGH RISK INVESTMENT WARNING:CFDs are complex instruments and come with a high risk of losing money rapidly due to leverage. Between 74-89% of retail investor accounts lose money when trading CFDs. You should consider whether you understand how CFDs work and whether you can afford to take the high risk of losing your money.
Trading through an online platform carries additional risks. Refer to our Regulation section here.