
- Home
- Blog
- Forecast and Price Predictions
- USD to INR Forecast 2026 and Beyond: Indian Rupee Rebound in 2026?
USD to INR Forecast 2026 and Beyond: Indian Rupee Rebound in 2026?
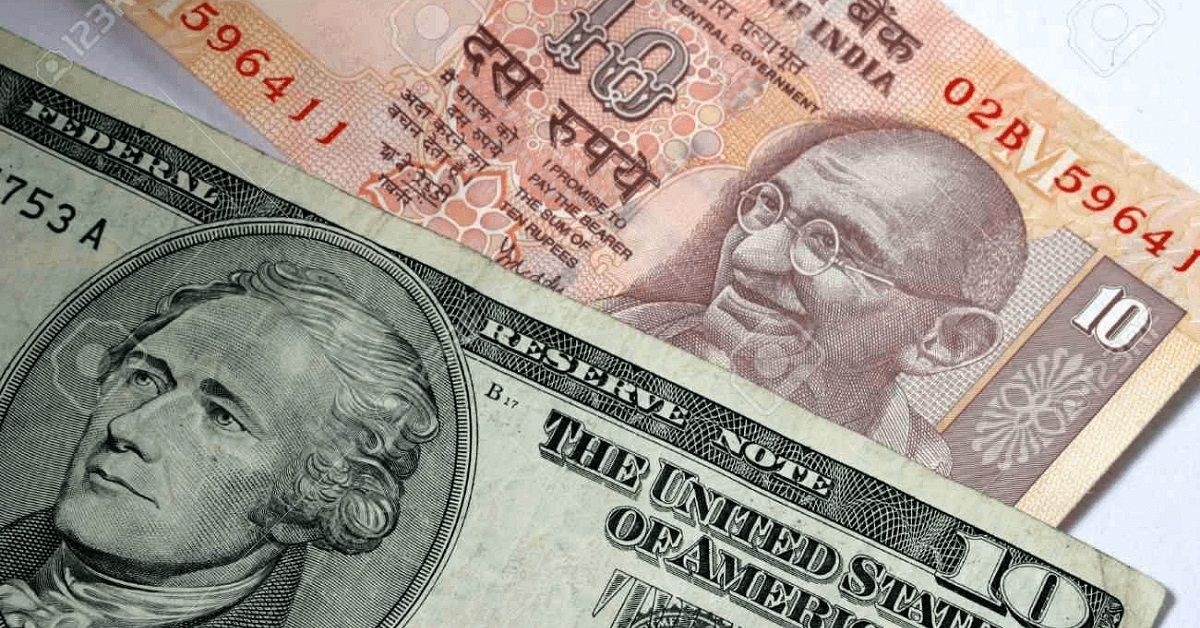
For the USD/INR, 2025 was a year marked by record lows under the pressure of prolonged negotiations, the lack of a US trade agreement, and ongoing foreign withdrawals from local stocks and bonds. This reflects a year-to-date drop of over 5.5%, positioning the rupee as Asia's weakest currency so far. Daily swings remain common, fueled by dollar buying from importers and hedging activity.
President Trump's earlier announcement of 50% tariffs on imports from India keeps undermining the competitiveness of Indian products and spurring capital outflows. Foreign portfolio investors have withdrawn more than $17-18 billion from equities this year, compounded by private equity sales through IPOs. Soaring costs for imported oil, metals, and electronics are widening the trade gap even further.
The Reserve Bank of India is adopting a light-touch strategy, stepping in only occasionally to permit a gradual rupee slide instead of aggressive support. The USD to INR forecasts are mixed, with some warning of more downside pressure if trade negotiations falter, and others predicting a potential Rupee rebound in 2026 amid a weaker dollar and improved risk appetite.
USD to INR Forecast 2026 – Summary
- USD to INR Forecast for the next days and weeks: The USDINR exchange rate is forecasted to continue near the crucial 90.0 level, although the Indian Rupee remains downside biased due to ongoing uncertainty over tariffs, which may weigh on market confidence in the near term.
- USD to INR Forecast 2026: Bank of America predicts the rupee may rise to 86/USD by 2026, citing recent weakness as the result of global forces rather than internal difficulties, while ING anticipates India will eventually win a lower tariff rate, with upside potential for the INR in 2026 (87.00 by the end of the year).
- USD to INR Forecast 2027-2030: Experts broadly agree that global monetary policies and India’s economic fundamentals will continue to shape USD/INR’s trajectory, with some AI models, like Pickup, forecasting a gradual INR appreciation towards the 80.00 - 78.00 area, while others, such as Wallet Investor, are pointing to a sustained INR depreciation towards the 110.00 level.
With NAGA.com, you can trade the most common currency pairs to the most exotic ones with an easy-to-use interface, low fees, and tight spreads.
USD to INR Forecast 2026 – Fundamental Outlook
The Indian Rupee (INR) underperformed among emerging market currencies in 2025, falling roughly 5.5% against the USD due to US-India trade tensions and high tariffs, despite strong macroeconomic fundamentals such as minimal current account deficits and substantial FDI inflows.
The INR hit near-record lows of 91.00 per USD (as of mid-December), trailing high-yield peers due to foreign investor outflows from stocks and uncertainties over tariffs of up to 50% on Indian exports.
However, the Indian economy is doing well, according to the most recent macro data, with improved domestic consumption and the industrial and services sectors driving economic growth for the sixth quarter in a row.
With the Federal Reserve cutting rates and engaging in de facto quantitative easing, and India anticipating bond purchases, the USD/INR remains biased toward consolidation with an upward lean (weakening INR) for the short-term.
The US–India trade narrative
Steep U.S. tariffs, climbing as high as 50% on imports from India, exacerbated the country's trade imbalance and drove up prices for critical imports like petroleum. Key industries—including gemstones, jewelry, electronics, and automotive parts—faced sharp drops in exports, endangering employment and stalling industrial growth. The falling rupee fueled inflation by hiking fuel costs and debt repayments.
Following the tariff rollout in April 2025, the Indian rupee lost more than 6% of its value versus the U.S. dollar, fueled by capital flight from foreign investors and a rush to dollar assets as a safe bet. This depreciation inflated the expense of servicing India's $682 billion in foreign debt and further strained the current account deficit.
Given traders' existing cautious stances, any developments—or further tensions—in US-India negotiations might quickly change the USD/INR trend. As markets struggle to price two stark scenarios, this ambiguity is significant:
- An effective deal would lower tariffs, improve confidence, and attract foreign investment back to Indian markets.
- A delayed deal or a failure would maintain high-risk premiums, while investors and importers will buy dollars on the dips.
In conclusion, a credible framework deal can change risk appetite quickly, but delays keep USD demand elevated.
Trade deficit and foreign outflows are adding pressure
The Indian Rupee (INR) has slumped to historic lows near 90.91 against the US dollar by mid-December 2025, largely due to a widening trade deficit and heavy capital outflows from the country.
India's trade gap shrank slightly to $24.53 billion in November, thanks to slower import growth. However, steep 50% US tariffs continue to hit exports hard while driving prices for fuel and other commodities. This dynamic is ballooning the current account deficit, boosting demand for dollars and dragging the INR lower—especially as negotiations for a bilateral trade deal with the US remain deadlocked.
In early December, foreign portfolio investors pulled out $1.2 billion from stocks and more than ₹13,459 crore from bonds, adding to $18 billion in total exits for 2025. Driven by a strong US dollar and ongoing trade tensions, these outflows have sparked capital flight and worsened the INR's nearly 6% drop over the year.
The softer currency is stoking inflation through pricier imports and making it tougher for companies to service dollar-denominated debt, even as it gives Indian exporters a competitive edge.
RBI smoothens volatility but shifted to a more flexible rupee
A common belief among traders is that the RBI has been present to limit the chaotic movements. Even though the Reserve Bank of India (RBI) has periodically interfered in recent months to reduce excessive volatility in the rupee, market participants claim that, since the currency crossed the 88.80 barrier, the central bank's support seems to have softened.
India has spent tens of billions of dollars protecting the rupee at "political levels" over the years. Therefore, the RBI now favors a controlled devaluation or a crawl that reflects global market pressures rather than burning reserves to artificially hold the currency around 82.00–84.00.
RBI & Fed Rate Cuts
Recent actions by the Reserve Bank of India (RBI), including a rate cut and liquidity injection, are weighing on the Indian rupee (INR), even as the US Federal Reserve's expected policy easing bolsters the US dollar (USD) relative to the INR. These dynamics—coupled with escalating trade frictions and investor exits—have pushed the USD/INR pair close to all-time peaks between 90 and 91.
RBI's Policy Effects
On December 5, 2025, the RBI lowered its repo rate by 25 basis points to 5.25% and pumped INR 1.4 trillion into the system via bond buys and forex swaps. This accommodative approach shows little resistance to rupee weakening, favoring economic expansion, and ample funds over aggressive currency support. As a result, USD/INR has edged past 90. Experts predict the INR could slide to 90.80 by September 2026 without breakthroughs in US-India trade agreements, assuming the RBI holds off on more cuts.
Federal Reserve's Role
Markets anticipate that the Fed will extend its rate-cutting phase in December 2025, fostering a broader USD softening worldwide in the medium term. Yet, against the INR, the dollar holds firm thanks to India's quicker policy loosening and pressures on its current account.
With RBI leaning more dovish amid tame inflation at 0.25% and solid 8.2% GDP expansion, the rupee faces heightened risks—worsened by $18 billion in overseas portfolio sell-offs. The pair recently touched fresh lows around 91.00, where RBI steps have curbed but failed to halt the decline.
The USDINR forecasts for 2026 range widely, from high 87.00 - 86.00 (if a deal and flows stabilize) to 90.80 - 91.00 (if risk premiums and trade deficit concerns continue).
USD to INR Forecast – The Latest Calls for Central Banks
Global central banks are easing rates post-peak, with the U.S. Federal Reserve and the Reserve Bank of India (RBI) cuts driving the USD/INR amid policy divergence and oil pressures.
When Will Interest Rates Go Down
Federal Reserve
The FOMC cut the federal funds rate 25 bps to 3.50%-3.75% on December 9-10, 2025—the third consecutive reduction. Described as "hawkish cut," it reflects moderate growth, slowing jobs, rising unemployment, and 2.8% inflation (above 2% target, tariff-linked). The statement stressed careful consideration for the "scope and pace" of future changes, with three dissenters highlighting internal splits; forecasts suggest few additional cuts in 2026, supporting a firmer U.S. dollar.
The CME FedWatch Tool now shows just a 65% probability of a rate cut in March 2026, a drop from earlier peaks, as strong growth curbs bets on aggressive easing. Banks such as Goldman Sachs and JPMorgan predict 2-3 more cuts by mid-2026 if economic indicators weaken. The upcoming FOMC gathering is set for January 27-28, 2026.
Reserve Bank of India
Reserve Bank of India (RBI) cut its repo rate by 25 basis points to 5.25% on December 6, 2025, marking its third reduction this year following 50 bps in June and 25 bps in October. Governor Shaktikanta Das highlighted cooling inflation at 4.8% (within the 4%±2% target) and GDP growth of 6.8% in Q3 but noted risks from global volatility.
The next Monetary Policy Committee meeting is February 4–6, 2026. Experts from HSBC and Nomura expect one more 25-bp cut in Q1 2026 to support credit growth, though a hawkish Fed could limit easing.
USD to INR Forecast – Technical Outlook
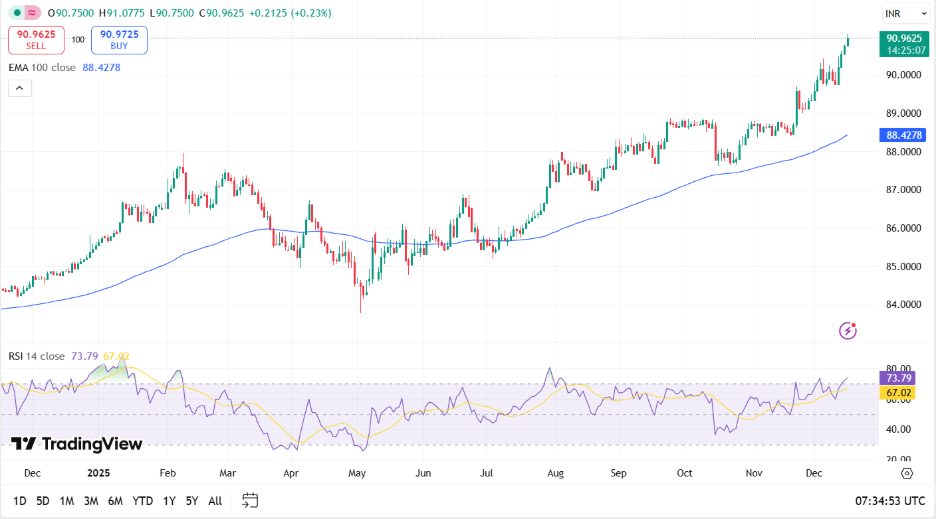
The USD/INR pair continues to show a significant upward movement on the daily chart, with the price breaking to a fresh all-time high, above the 90.90 mark, and holding above the key 100-day Exponential Moving Average (EMA). The 14-day Relative Strength Index (RSI) stands at the 74 level, which might signal a potential pullback from an overbought area.
The key support level is 90.00, the second support is 89.80, and higher at 89.50, while the key resistance level is 91.00.
Past performance is not a reliable indicator of future results. All historical data, including but not limited to returns, volatility, and other performance metrics, should not be construed as a guarantee of future performance.
USD to INR Forecast – Institutional and AI-Algorithms Price Predictions 2026-2030
Below is the updated data of the USD to INR forecasts as of {month} {year}. It either can be altered or can be proved to be wrong, as it is based on essential factors like a US-India trade deal, interest rates, and central bank monetary policy, in line with market assumptions. It is important to research and analyze, keeping in mind that past displays do not assure future outcomes.
USD to INR Forecast by Reuters Poll
A Reuters poll from December 1–3, 2025, surveying 37 analysts, predicts the Indian rupee will strengthen from mid-December levels, with a median forecast of USD/INR improving to ~88.91 by end-February 2026 and ~88.83 by end-May 2026.
This outlook contrasts with earlier pressures from record lows near 91.00 amid U.S. trade tensions, suggesting potential recovery if tariffs ease.
USD to INR Forecast by CareEdge Ratings
CareEdge Ratings expects the USD/INR to be at 87.00 at the end of FY26. This reflects expected Fed rate cuts and US-India trade progress against the backdrop of an undervalued rupee, suggesting some room for a medium-term appreciation.
USD to INR forecast by Bank of America
According to Reuters, Bank of America forecasts that the Indian rupee may appreciate against the US dollar, reaching approximately 86 INR per dollar by the end of 2026. They blame the recent currency decline on global factors rather than India's local economy.
For 2026, the bank forecasts a global slowdown, led by the United States, resulting in a weaker dollar, stable trade, and improved investor sentiment to support the rupee. However, prolonged global caution, sluggish capital inflows, or rising oil prices may cause downward pressure.
USD to INR forecast by ING Bank
The Indian Rupee (INR) is expected to strengthen to about 87.00 INR per USD by the end of 2026, according to ING Bank's forecast for late 2025/2026. This strengthening is expected to be fueled by strong fundamentals, possible US-India trade deal catalysts, and the INR's undervaluation in comparison to peers, though the short-term strength of the U.S. dollar and high crude prices create near-term pressure.
USD to INR Forecast by Wallet Investor
Wallet Investor forecasts the USD to INR exchange rate to trend higher in 2026, indicating a weakening rupee against the dollar. Their projections suggest rates potentially reaching 93.21 at the end of 2026 and 103.57 by December 2030.
USD to INR Forecast by AI Pickup
The Artificial Intelligence (AI) Pickup algorithm supports the scenario of a weaker INR in 2026, potentially reaching 93.00 by the end of the year, but a gradual appreciation across 2027-2030. Specifically, the AI algorithms USD to INR forecast points towards an INR advance up to 91.50 in 2027, 87.27 in 2028, 84.87 in 2029, and 78.35 in 2030.
Summary of USD to INR Forecast for 2026
- With ongoing uncertainty over tariffs, trade deficit, and foreign outflows still in place, and an RBI stance shifted to a more flexible rupee, the USD to INR forecasts are mainly pointing to a continuation near the crucial 90.00 - 91.00 area in the short-term.
- Although forecasts suggest that some global headwinds, such as trade tariffs and trade deficit, pose depreciation risks, India's strong economic fundamentals and potential foreign investment inflows could lead to a more stable or even appreciating currency in the long run, with BofA and ING predicting an INR/USD appreciation towards the 86.00 - 87.00 area by the end of 2026.
*It is worth keeping in mind that both analysts and online forecasting sites can and do get their predictions wrong. The USD to INR price predictions based on AI are generated using algorithmic and AI-based models that rely on historical data and assumptions. Keep in mind that past performance and forecasts are not reliable indicators of future returns.
When considering USD/INR forecasts and price predictions for 2026 and beyond, it’s important to keep in mind that high market volatility and the macroeconomic environment make it difficult to produce accurate long-term USD/INR analyses and estimates. As such, analysts and forecasters can get their USD to INR forecast wrong.
It is essential to do your research and always remember that your decision to trade depends on your attitude to risk, your expertise in the market, the spread of your investment portfolio, and how comfortable you feel about losing money. You should never invest money that you cannot afford to lose.
Sources:
- https://www.reuters.com
- https://think.ing.com/articles/asia-2026-fx-outlook
- https://www.rbi.org.in/Scripts/BS_PressReleaseDisplay.aspx
- https://www.federalreserve.gov/
- https://www.deloitte.com/us/en/insights/topics/economy/asia-pacific/india-economic-outlook.html
- https://www.goldmansachs.com/insights/goldman-sachs-research
- https://www.morganstanley.com/im/publication/insights/articles/article_theindiaopportunity_ltr.pdf




The present domain / website, NAGA.eu is owned by Naga Technology GmbH, however is independently and exclusively operated by Axon Securities S.A., an AEPEY which is authorised and regulated by the Hellenic Capital Market Commission (HCMC) under licence No. 7/560/02.09.2010 and with registered address 48 Stadiou Street, 105 64 Athens, Greece.
NAGA is a trade name and trademark under the NAGA Group AG, a German based FinTech company publicly listed on the Frankfurt Stock Exchange | WKN: A161NR | ISIN: DE000A161NR7. Exclusive rights for the use of the said trade name and trademark, in the territory of Greece, are exclusively granted to Axon Securities S.A. In this respect and for the avoidance of doubt, any references in the present domain to "NAGA" refer just to the brand/trade name/trademark, the NAGA Platform or account and not to any specific company under NAGA Group of companies.
RESTRICTED JURISDICTIONS:With regards to the current website, Axon Securities S.A. offers services to Greek residents. Axon Securities S.A does not provide investment and ancillary services in the territories of third countries including Japan, Canada and the USA. For further details please refer to our Terms & Conditions.
HIGH RISK INVESTMENT WARNING:CFDs are complex instruments and come with a high risk of losing money rapidly due to leverage. Between 74-89% of retail investor accounts lose money when trading CFDs. You should consider whether you understand how CFDs work and whether you can afford to take the high risk of losing your money.
Trading through an online platform carries additional risks. Refer to our Regulation section here.