
- Home
- Blog
- Forecast and Price Predictions
- Dow Jones Forecast and Price Prediction 2026: Bullish with downside risks
Dow Jones Forecast and Price Prediction 2026: Bullish with downside risks

The Dow Jones Industrial Average (DJIA) index rose 12.7% in 2025, climbing from around 42,660 at the January open to 48,063 by December 31 close. Including dividends, the total return reached 14.9%, reflecting the impact of mature dividend payers amid enthusiasm for AI and the FED rate cuts.
Industrials led the Dow sector contributions in 2025, with Caterpillar (+59%) powering much of the index's 12.7% rise through resilient demand and record highs despite tariffs. Financials ranked second, driven by Goldman Sachs' 54-55% advance, fueled by the FED’s easing, which boosted trading revenues and M&A activity in a no-recession backdrop. Health Care placed third with Johnson & Johnson's 44-46% gains as a defensive standout, while Technology rounded out top spots via Nvidia (40%) and IBM (37%) on AI tailwinds.
Dow Jones forecasts for 2026 indicate continued gains amid AI-momentum, Fed easing, and resilient earnings, although tariff risks add volatility. However, the upside potential is limited according to the latest Dow Jones price predictions, with additional risks such as the election aftermath and debt ceiling debates, potentially capping the index at 50,000 points if economic growth slows below 2%.
In this 2026 Dow Jones outlook, we explore key market drivers, including Federal Reserve monetary policies, economic growth, geopolitical developments, and sector performance, to provide insights into possible future price trajectories. What is the Dow Jones forecast for 2026 and beyond?
Key Dow Jones Forecast & Price Predictions - Summary
- Dow Jones forecast Q1: After reaching new highs in early 2026, the Dow Jones index is forecasted to reach 51,300-53,000 points amid momentum and a bullish chart pattern that suggests a more likely exhaustion rally.
- Dow Jones price prediction 2026: While the index could reach 53,000 points during the year based on the price extensions, a correction towards the support of the primary uptrend, around 45,000 points, is very likely during the year.
- Dow Jones price prediction for the next 5 years: Looking further ahead, long-term forecasts are tilted bullish, projecting the Dow could gradually reach the 60,000s by 2030, provided earnings growth remains healthy and fiscal policies stay market-friendly.
With NAGA.com, you can trade Dow Jones through CFDs if you want to speculate on price movements or invest in Dow stocks or ETFs.
Dow Jones Forecast 2026 – Fundamental Outlook
Expectations for further Fed rate cuts in 2026 and resilient earnings from corporate America continue to support a strong outlook for blue-chip stocks. There are a few solid reasons to believe this run can’t extend into the next year.
The Bull case for 2026
The Dow Jones outlook for 2026 hinges on sustained US GDP growth near 2.0-2.6%, bolstered by fiscal stimulus and AI investments that lift corporate earnings across industrials and tech components.
Robust consumer spending and infrastructure outlays should propel GDP above 2025 levels, with Fed funds stabilizing at 3.00-3.25% after modest cuts supporting capex without reigniting inflation. Political tailwinds from tax refunds and delayed tariffs further underpin resilience, though debt ceiling risks could spark Q2 volatility.
Blue-chip constituents are targeting 8-12% EPS growth, led by financials and healthcare, which benefit from lower funding costs and defensive demand. Meanwhile, companies like Caterpillar benefit from global capital expenditures (CapEx) cycles. Morgan Stanley highlights US equities as the guiding force for broader rallies, with Dow Jones tracking S&P strength and advancing above the 50,000 points for the first time in history.
Yet Wall Street analysts also note that uncertainty about Trump’s pick for Federal Reserve Chair as well as persistent geopolitical tensions and tariffs could create headwinds for stocks after such strong recent gains.
The Bear case for 2026
Key macro risks for the Dow Jones in 2026 center on elevated valuations, AI investment returns faltering, and persistent inflation forcing Fed policy shifts.
Valuations — a measure of how pricey a stock is relative to the company’s earnings — were a hot topic in 2025, with Wall Street analysts noting that US stocks are becoming increasingly expensive.
While not a market-timing tool, high valuations can often correspond with undersized future returns (unless earnings growth continues to exceed expectations). After three years of such eye-watering gains, some strategists are less certain that US stocks have significant upside potential.
US equities trade at premiums, demanding flawless execution, with the Dow’s concentration in mega-caps amplifying downside if earnings growth slows to single digits or margins compress due to wage hikes. Any deceleration below consensus 8-12% EPS forecasts could trigger multiple contractions.
Sticky inflation or tariff passthroughs risk higher-for-longer Fed funds near 3.50%, steepening yield curves and squeezing equity discounts amid debt ceiling brinkmanship. Rate volatility spilling into growth stocks would hit Dow tech like IBM hardest.
Trade frictions with China or energy shocks from Middle East tensions could disrupt industrials like Caterpillar, while a K-shaped US slowdown hits consumer cyclicals. Government shutdowns or fiscal cliffs can add turbulence in Q1, with BlackRock noting macro softening as a top concern.
Under such scenarios, Dow Jones is forecasted to decline 10-20% from its high.
Dow Jones Forecast 2026 – Technical Outlook
In November 2025, the Dow began outpacing the Nasdaq — a sign that the stock market rally was spreading to previously left-behind companies, and expanding beyond just AI, helping support overall gains.
The recurring cycle equity indices often experience during a president’s second year in office. Historically, sharp policy shifts are frequently followed by consolidation or corrective phases, allowing markets to reset before resuming their primary trend.
Beyond the Dow’s contracting chart pattern structure, the Nasdaq is displaying a notable divergence relative to both the Dow and the S&P 500. The index has failed to record new highs since October 2025, raising questions around AI and technology valuations, as well as the sustainability of investment appetite in the sector amid an increasingly uncertain geopolitical backdrop heading into 2026.
Past performance is not a reliable indicator of future results. All historical data, including but not limited to returns, volatility, and other performance metrics, should not be construed as a guarantee of future performance.
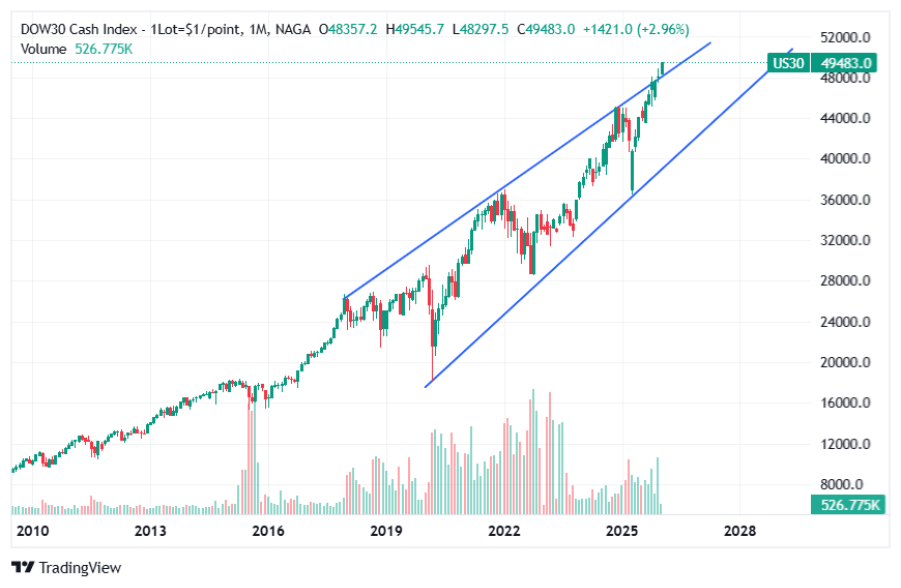
Examining the Dow Jones index monthly time frame above, a clear contracting price structure emerges, connecting consecutive higher highs from January 2022, November 2024, and December 2025. This diagonal-like, rising wedge-type formation increases the risk of sharper price scenarios as the Dow approaches the 50,000 threshold.
Should a clean breakout above the 50,000 level occur, an exhaustion rally becomes likely with price extensions toward 51,300 and 53,000 as main targets. These targets are derived using the Fibonacci extension tool, measured from the September 2022 low to the November 2024 high, and projected from the April 2025 low.
On the downside, in line with overbought monthly RSI conditions and a trendline connecting higher highs between 2022 and 2025, a sustained move below 48,000 could extend corrective projections toward 45,000 and potentially 40,500. Such a scenario would likely coincide with a broader market pullback or corrective phase (intermediate trend countertrend according to the Dow theory) before the longer-term uptrend resumes.
Dow Jones Forecast 2026 – What Are Experts Saying?
Before we move on, we’d caution against putting too much weight into one-year targets. It’s extremely difficult to predict short-term market movements with any accuracy. Few on Wall Street have ever been able to do this successfully. We do, however, think the research, analysis, and commentary behind these forecasts can be informative.
Citi projects the S&P 500 at 7,700 (24x $320 EPS), translating to a Dow of over 52,000 on similar multiples amid broadening AI and fiscal impulse. Bank of America targets 7,100 for the S&P 500, suggesting a Dow Jones price prediction of 50,000-51,000 with modest 3-5% upside from robust economic assumptions. Deutsche Bank targets S&P 8,000, bullish for Dow Jones to 54,000 on 17% rally potential from policy tailwinds.
Ed Yardeni forecasts S&P 7,700 (12.5% gain), aligning Dow Jones with 52,000 via strong earnings and 20% recession odds. CNBC strategist consensus hits S&P 7,629 median (13% up), pointing Dow Jones at 53,000 on continued bull momentum.
Below are the institutional forecasts for the S&P 500 adjusted to the Dow Jones using EPS.
- Oppenheimer - 8,100
- Capital Economics - 8,000
- Deutsche Bank - 8,000
- Morgan Stanley - 7,800
- Wells Fargo - 7,800
- Citigroup - 7,700
- UBS - 7,700
- Ed Yardeni - 7,700
- Goldman Sachs - 7,600
- HSBC - 7,500
- JPMorgan Chase - 7,500
- CIBC Capital Markets - 7,450
- Barclays - 7,400
- CFRA Research - 7,400
- Bank of America - 7,100
Bank/Firm 2026 Target Key Drivers Citi 52,000 Broadening AI and fiscal impulse Bank of America 51,000 Robust economic assumptions Deutsche Bank 54,000 Policy tailwinds Ed Yardeni 52,000 Strong earnings and 20% recession odds CNBC 53,000 Continued bull momentum Table with Dow Jones Forecast and Price Predictions
Dow Jones Price Prediction 2026 from AI-Based Websites
Trading Economics forecasts the Dow Jones Index to be priced at 46,878 by the end of this quarter and at 42,639 in one year, according to their global macro models projections and analysts' expectations.
WalletInvestor maintains a long-term bullish outlook for the DJIA through technical analysis, emphasizing sustained upward momentum based on chart patterns as of early 2026. Recent updates indicate specific projections for 2026, with the index expected to close the year near $53,717, assuming technical structures hold amid modest correction risks. This aligns with the current DJIA level above 49,000, supporting their growth trajectory forecast.
Long Forecast provides a detailed breakdown for the Dow Jones Industrial Average. Their latest projection forecasts the end of March around 53,200 points. The 2026 outlook, rooted in price cycles and seasonal trends, suggests the Dow Jones may rise to 64,542 points by the end of 2026, and is poised to approach 80,000 in 2027, if the momentum holds.
Dow Jones Price Prediction 2026-2030 (US30 Forecast)
Analysts forecast a consistent climb for the DJIA from 2026 to 2030, fueled by growing company earnings, looser monetary policy, and strengthening economic fundamentals. The index has already pushed past 42,000 in early 2026, up roughly 8% since late 2025, thanks to solid profits and tame inflation. CoinPriceForecast sees it hitting 50,000 by the close of 2027, advancing to 60,000 by late 2029, and surpassing 70,000 near 2031. Their bold outlook draws on the market's past upward patterns.
Ed Yardeni of MarketWatch offers a steadier trajectory, expecting the Dow to reach 60,000 by 2030 at about 7% yearly growth, powered by robust profits and expanding price-to-earnings multiples.
Other experts agree that ongoing profit gains and positive chart patterns could lift the Dow to 55,000 by 2028 or later.
Overall, experts largely expect the DJIA to break into the mid-50,000s around 2028–2029 and approach 60,000 by 2030, supported by optimistic earnings trends and enduring bullish market signals.
*It is worth keeping in mind that both analysts and online forecasting sites can and do get their predictions wrong. Keep in mind that past performance and forecasts are not reliable indicators of future returns. When considering Dow Jones price predictions for 2026 and beyond, it’s important to keep in mind that high market volatility and macroeconomic environment make it difficult to produce accurate long-term Dow Jones analysis and estimates. As such, analysts and forecasters can get their Dow Jones forecast wrong.
It is essential to do your research and always remember your decision to trade depends on your attitude to risk, your expertise in the market, the spread of your investment portfolio, and how comfortable you feel about losing money. You should never invest money that you cannot afford to lose.
Factors That Can Impact the Dow Jones Stock Price
- Current News - The price of the Dow Jones is calculated using data from its companies. That is why it is important to keep a close eye on all the major news and results of the companies that weigh the most in this reference index.
- Economic Data - Figures may include unemployment, trade balance, GDP growth rate, inflation rate, retail sales, durable goods, industrial orders, business sentiment, or consumer confidence.
- U.S. Dollar - The value of the U.S. dollar will affect the export or import profitability of U.S. listed companies. If the U.S. dollar is going down, the stock index tends to rise also.
- FED - Communications from the U.S. Federal Reserve on interest rates, as well as the press conferences of these organizations usually impact the Dow Jones index.
Is Dow Jones a good investment?
The Dow Jones was first available in May 1896 and first traded at 40.94 points. Since the market now trades above 44,000 points it has returned more than 100,000 % return. On an annual average the market has returned about 5.7%. The values are adjusted for inflation according to the Dow Jones Return Calculator, Dividends Reinvested (DQYDJ).
In recent years, the Dow Jones price has risen enormously, as can be seen in the above tables. The Dow Jones rate has been tracked since 1896, and in 1976, the 1000-point limit was broken. Subsequently, the limit of 20,000 points was reached in 2017, and the Dow Jones price is now trading above the 44,000 points mark.
Nevertheless, the question remains where the limit lies for the Dow Jones index. What has become clear is that the Dow Jones price has become much more volatile, with daily fluctuations of hundreds of points being no exception.
Analysts outlined in the article viewed the Dow Jones Industrial Average (US30) could resume more upside if inflation is starting to slow. However, with the Fed currently remaining on hold in terms of further rate cuts the situation might remain unclear.
Whether or not Dow Jones is a good investment for you depends on your attitude to risk, your expertise in this market, the spread of your portfolio, and how comfortable you feel about losing money.
How to invest in Stock Indices
Read also our monthly updates on fx, commodity, and stock market:
- Euro to Dollar forecast and price prediction 2026
- Pound to Dollar forecast and price prediction 2026
- USD to INR forecast 2026, 2027, 2030
- AED to INR forecast 2026, 2027, 2030
- SAR to INR forecast 2026, 2027, 2030
- Gold forecast and price prediction 2026
- Oil forecast and price prediction 2026
- Nasdaq-100 forecast and price prediction 2026
- Natural Gas forecast and price prediction 2026
- Silver forecast and price prediction 2026




The present domain / website, NAGA.eu is owned by Naga Technology GmbH, however is independently and exclusively operated by Axon Securities S.A., an AEPEY which is authorised and regulated by the Hellenic Capital Market Commission (HCMC) under licence No. 7/560/02.09.2010 and with registered address 48 Stadiou Street, 105 64 Athens, Greece.
NAGA is a trade name and trademark under the NAGA Group AG, a German based FinTech company publicly listed on the Frankfurt Stock Exchange | WKN: A161NR | ISIN: DE000A161NR7. Exclusive rights for the use of the said trade name and trademark, in the territory of Greece, are exclusively granted to Axon Securities S.A. In this respect and for the avoidance of doubt, any references in the present domain to "NAGA" refer just to the brand/trade name/trademark, the NAGA Platform or account and not to any specific company under NAGA Group of companies.
RESTRICTED JURISDICTIONS:With regards to the current website, Axon Securities S.A. offers services to Greek residents. Axon Securities S.A does not provide investment and ancillary services in the territories of third countries including Japan, Canada and the USA. For further details please refer to our Terms & Conditions.
HIGH RISK INVESTMENT WARNING:CFDs are complex instruments and come with a high risk of losing money rapidly due to leverage. Between 74-89% of retail investor accounts lose money when trading CFDs. You should consider whether you understand how CFDs work and whether you can afford to take the high risk of losing your money.
Trading through an online platform carries additional risks. Refer to our Regulation section here.