
- Home
- Blog
- Forecast and Price Predictions
- Ethereum Price Prediction: Will ETH finally rally?
Ethereum Price Prediction: Will ETH finally rally?

Ethereum's wild ride through 2025 saw ETH/USD price surge past $5,000 on spot ETF approvals and Dencun/Pectra upgrades, only to fall to $3,500 in Q4 amid macro volatility.
2026 is forecasted to be the most bullish year yet, not because of the hype, but because of the structure. Network usage is climbing even as prices remain subdued, with Ethereum expected to lead the tokenisation of real-world assets. Institutional participation is accelerating. Regulatory clarity is coming into focus.
While the ETH/USD price has floundered in recent years, Wall Street is making big bets on Ethereum for 2026 and beyond.
Ethereum Forecast & Price Predictions - Key Takeaways
- Ethereum price prediction today: In the near term, Ether’s outlook will depend on whether selling pressure stabilises and whether broader markets regain their footing. A period of consolidation at the 3,000$ key support area may be needed to rebuild confidence after the sell-off.
- Ethereum price prediction 2026: ETH is expected to reach new ATHs during the year, with forecasts averaging $7k-10k on ETF $100B+ AUM, L2 TVL explosion, and restaking yields.
- Ethereum price prediction 2026-2030: Several veteran analysts and market experts are quite bullish on Ethereum and maintain a positive long-term outlook, forecasting Ethereum to touch even $25,000 in the next few years.
With NAGA, you can trade CFDs on ETH/USD and ETH/EUR with leverage, HODL Ethereum with NO Fees* (T&Cs apply), or buy shares in a Crypto ETF.
Ethereum Forecast 2026: Strategic drivers
Ethereum has not followed Bitcoin’s performance in the last few years, but its fundamentals are arguably stronger than at any point in its history. In its 2026 Ethereum outlook, BlackRock looks towards the next era of tokenization, and Ether may be poised to be a beneficiary of growth.
While Ethereum largely lagged, barely exceeding its 2021 peak before pulling back sharply, these forces suggest that the second-largest digital currency by market cap might be one of the best cryptocurrencies to buy in 2026.
Glamsterdam & Hegota Upgrades Supercharge Scaling
- Ethereum's 2026 roadmap kicks off with Glamsterdam (H1), the successor to Pectra/Fusaka, overhauling execution for parallel txns and aiming for 200K TPS;
- Hegota (H2) adds sharding foundations, slashing L2 fees 95% via blobs—drawing devs/AI agents;
- These build on Dencun's proto-danksharding success, boosting throughput without congestion.
RWA Tokenization Draws Trillions
- ETH leads RWA with $12.6B TVL and $4.6B in tokenized Treasuries—BlackRock bullish on institutional migration as TradFi eyes blockchain yields;
- Stablecoins at $171B (USDT/USDC) beget capital inflows, requiring ETH for gas/DeFi;
- A $10T tokenized market by 2030 favors Ethereum's liquidity.
Spot ETFs & Restaking Institutional Magnet
- Post-2025 ETFs ($50B AUM): inflows accelerate with pension allocations;
- EigenLayer restaking yields 5-20%; locks $100B+; Atkins' regs enable ETPs.
- Institutions hold ETH for ops as DeFi TVL hits $500B—outpacing Solana via security/EVM dominance.
AI-DeFi Convergence & Network Effects
- 1.2M DAU, $150B DeFi volume explodes with AI agents on Verkle trees (2026);
- L2s like Base/Arbitrum capture 80% activity;
- Staking ROI of 4-6% + restaking multipliers draw $200B in locked supply, consolidating the moat vs. rivals.
These build on Dencun's proto-danksharding success, boosting throughput without congestion. In December last year, JPMorgan chose the network for its first-ever tokenized money market fund, an asset class valued at $9 trillion. In January, Morgan Stanley filed to launch an Ethereum exchange-traded fund (ETF) product.
ETFs backed by crypto assets are attracting strong investments. BlackRock’s iShares Ethereum Trust ETF is leading with over $10 billion in assets under management, followed by Grayscale and Fidelity. Digital asset treasury firms are also buying and staking Ethereum tokens, backing the bullish Ethereum forecast and price predictions for 2026 and beyond.
Technical Ethereum Forecast: ETH price could target $4,000 again
Ethereum’s price has floundered in recent months, trading at around $3,000 at the beginning of the year, nearly 40% below its all-time high set back in August 2025. It is down 10% over the past year despite macroeconomic tailwinds that have pushed assets such as technology stocks and gold to new all-time highs.
In the near term, Ether’s outlook will depend on whether selling pressure stabilises and whether broader markets regain their footing. A period of consolidation around the 3,000 level (+/- 300 USD) may be needed to rebuild confidence after the abrupt move.
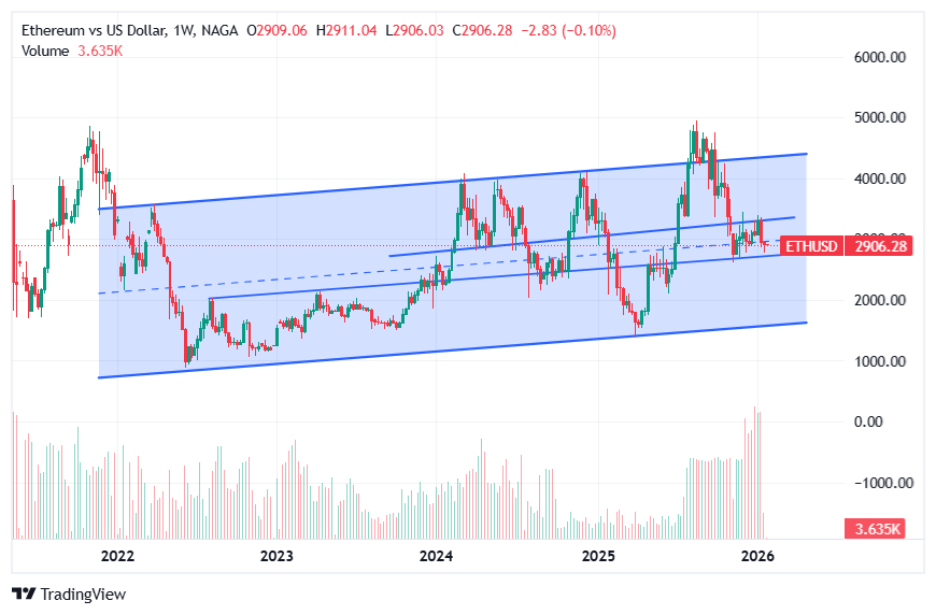
Past performance is not a reliable indicator of future results. All historical data, including but not limited to returns, volatility, and other performance metrics, should not be construed as a guarantee of future performance.
Ether bearish case 2026
Ether's sharp sell-off seems to have temporarily halted, but downside pressure remains in play while no bullish reversal takes ETH above its consolidation area.
In the event of a failure to overcome the $3,300 area, further downside towards the mid-2025 low of around $2,000 is likely. However, from a chart pattern perspective, that seems to be the best buy-the-dip opportunity, the lowest price that keeps a bullish medium-term outlook for Ethereum.
Ether bullish case 2026
For Ether's bearish momentum to be completely reversed, a fake breakdown below the $2,700 would need to be seen. Alternatively, a confirmed breakout above the $3,300 level suggests that a test of the ATH is more likely.
The chart pattern supports both a bullish ETH forecast to $4,800 ATH and the bearish ETH price prediction toward $2,000. The bearish movement should be short-lived, with the price expected to continue its long-term uptrend, supported by strong fundamentals and its role as a productive stake in a global transaction network.
Ethereum Price Predictions 2026
Institution 2026 Target Key Bull Drivers Key Risks VanEck $15,000 ETFs $150B AUM, sharding 100K TPS BTC dominance >60% JPMorgan $10,000 Proto-danksharding L2s, ETH/BTC 0.05 Regulatory relitigation ARK Invest $25,000 AI-DeFi $50B revenue, $2T mcap L2 fee cannibalization Standard Chartered $12,000 Pension inflows, restaking $100B Solana competition Fundstrat $18,000 L2 TVL $500B, AI agents Macro risk-off Citi $5,440 Sustained ETF inflows Demand slowdown InvestingHaven $4,200 avg DeFi/L2 scaling $1,500 bear case Table with institutional Ethereum price predictions 2026
VanEck: $15,000
VanEck's bullish $15K call for the end of 2026 positions Ethereum as a "triple-point asset"—a capital preserver, a consumer staple via stablecoins, and a store-of-value rivalling BTC—with spot ETFs expected to reach $150B. Pectra/Glamsterdam upgrades unlock 100K TPS via sharding, boosting dApp revenue to $20B annually while tokenized RWAs hit $100B in TVL on BlackRock platforms. The institution forecasts a $2T+ mcap as L2s like Optimism/Base mature, though BTC dominance risks capping the ETH/BTC ratio below 0.04.
JPMorgan: $10,000
JPMorgan analysts forecast $10K on proto-danksharding's L2 fee slash (95% drop), driving TVL to $400B and ETH/BTC rebound to 0.05 as Ethereum outpaces Bitcoin short-term amid restaking primitives like EigenLayer yielding 10%+. Spot ETFs mirror BTC's $250B success with $75B AUM, fueled by pension allocations and AI agent txns. Regulatory clarity under the Atkins framework mitigates security concerns, but Solana's speed poses niche rivalry.
ARK Invest: $25,000
Cathie Wood's ARK eyes $25K as a steppingstone to $180K by 2030, with Ethereum morphing into an AI-DeFi backbone generating $50B in annual revenue from 10M agents on Verkle-optimized trees. Big Ideas 2026 forecasts 700% mcap growth to $3T via tokenized Treasuries ($500B) and global stablecoins settling $5T daily on ETH rails. ETFs unlock $200B institutional flows, staking/restaking locks 40% supply—outshining gold scarcity with programmable utility, despite L2 revenue splits.
Standard Chartered: $12,000
Standard Chartered's revised $12K target reflects post-2025 ETF saturation, sustained pension inflows from the $40T U.S. pool (1% = $400B in demand), and L2 scaling, pushing DeFi into mainstream finance. Restaking TVL surges $150B via EigenLayer/Sybil, Glamsterdam sharding hits 50K TPS; ETH as "digital oil" powers RWAs like BlackRock funds. Macro Fed cuts amplify, though quantum risks and BTC halving siphon liquidity.
Fundstrat: $18,000
Tom Lee's Fundstrat calls $18K in Ethereum "super-cycle," with L2s absorbing BTC ETF spillover as TVL tops $500B and AI agents drive 2M DAU. Pectra/Hegota upgrades parallelize txns for sub-second finality; tokenized assets capture 5% of $200T global wealth; ETF AUM doubles to $100B on institutional FOMO. ETH/BTC flips to 0.06 amid DeFi yields beating Treasuries, but risk-off from geopolitics caps upside.
Citi: $5,440
Citi's conservative $5,440 ETH price forecast in 12 months hinges on steady ETF inflows post-2025 boom, mirroring BTC's path as Ether demand builds via stablecoins and basic DeFi plays. They note modest year-end gains extending into 2026, driven by institutional rotation out of overbought BTC, with staking rewards drawing $100B in locked value. L2 maturity tempers volatility, but broader adoption lags without full sharding.
InvestingHaven: $4,200 Average
InvestingHaven's $4,200 average Ether price prediction spans the $3K-$6K range, banking on DeFi expansion and Layer-2 scaling amid ETH 2.0 upgrades like Glamsterdam, which is boosting throughput. $2.8K-$3K support holds for recovery, targeting $5.5K if the price breaks the $3.5K level; otherwise, even $1.5K is a potential ETH target on breakdowns. Fundamentals strengthen institutional demand, though volatility persists.
Tyler Winklevoss, an investor and the creator of Winklevoss Capital Management and the Gemini cryptocurrency exchange, projected that Ethereum might be valued as much as gold. This would place the price of Ethereum at $80,000 based on the 10 trillion market capitalization of gold at the time of the interview.
Ronghui Gu, CEO of the smart contract audit company CertiK, forecasts Ethereum at $30,000 to $50,000 by 2030.
Bill Barhydt, CEO of trading platform Abra, once said in an interview with CNBC that Ethereum could touch a price of $40,000. This is thanks to the various use cases of the Ethereum blockchain and the Ether cryptocurrency, he said.
AI-based Ethereum Price Predictions for 2026 and 2030
Let’s examine some of the Ethereum price predictions posted by AI-based websites in January 2026.
Ethereum Price Prediction for 2026
LongForecast said ETH would trade at $3,189 by the end of 2026. Meanwhile, WalletInvestor forecasts Ethereum to close 2026 at $3,213. DigitalCoinPrice‘s Ethereum price forecast had it at $4,401 in December this year.
Ethereum Price Prediction for 2027
Looking ahead to 2027, WalletInvestor forecasts Ethereum will climb at an average price of $3,565. LongForecast’s prediction is $3,357. DigitalCoinPrice said ETH would reach $5,360 by the end of next year.
Ethereum Price Prediction for 2030
WalletInvestor believes the coin could trade at $4,6425 in 2030. LongForecast sees Ethereum at $3,896 in January 2030. DigitalCoinPrice’s ETH price prediction for 2030 points to an average price of $3,934 at the end of the decade.
While we can speculate about the potential price of Ethereum over the next months and years, the truth is that Ethereum still is a highly speculative investment. There is not much historical data to support these predictions. It is important to invest only what you are willing to lose and include some traditional investment instruments to build a strong portfolio.
Your investments should be small, and you should not place crypto investments above other financial goals, such as saving for retirement or paying off high-interest debt.
Learn more about Cryptocurrency trading
Is It Possible to Forecast the Price of Ethereum?
Many price predictions for Ethereum are flawed because they lack the necessary analytical support. Investors will always be attracted to a high price point, especially one that is on an upward price trend. Someone holding a cryptocurrency priced at $0.01 could easily believe that it will rise to $10,000 just because it sounds good.
The problem is that predictions can be made without any evidence or analysis. However, three types of analysis have been used in the financial world for a long time to try to forecast prices and the evolution of markets.
- Technical Analysis
- Fundamental Analysis
- Sentimental Analysis
Ethereum Forecast using fundamentals
Investors in financial markets use fundamental analysis to study and evaluate the variables that impact an asset’s price.
You can assess the intrinsic value of a cryptocurrency to determine if it is undervalued or overvalued. This can be achieved by analyzing qualitative factors like the state of the economy and cryptocurrency market conditions, as well as the management and market capitalization of crypto companies.
Fundamental analysis can help traders determine the price of a cryptocurrency based on a wide range of information. This could be a great way to make long-term investment decisions.
How to conduct an Ethereum price prediction today using fundamentals?
Fundamental analysis is when you examine the fundamentals of cryptocurrency projects, from their market capitalization to the utility and value of the native token.
Do not confuse fundamental analysis and technical analysis. Fundamental analyses of cryptos are more qualitative and less tangible than statistical trends like price charts or historical market data.
The fundamental analysis of cryptocurrency is like that of traditional financial markets, with more traditional assets such as stocks. It is not as important to focus on a company’s historical financial performance, financial statements, or balance sheets.
The following parameters can be used to help investors predict trends in crypto markets:
- Market capitalisation
- Total and circulating supply
- Token utility and use cases
- Community size
- The team of the crypto project
- The crypto's trading volume
- Crypto exchanges' listings
- Partnerships with trusted institutions
- The latest news about the coin
- Government rules and regulations
It is important to remember that fundamental analysis can only give you an overview of cryptocurrency investments. You can better understand the project and the future changes in cryptocurrency prices by looking at all the information. To get a better picture, you can also refer to the company’s whitepaper.
You can also examine blockchain metrics, which provide crucial information about a cryptocurrency's technology and processes.
Ethereum Forecast using technical analysis
Technical analysis uses historical price charts and market statistics to examine and anticipate price changes in the financial markets. It is founded on the concept that if a trader can recognize historical market trends, they may anticipate future price trajectories accurately.
Whereas fundamental analysis focuses on an asset's 'real value,' considering both external and intrinsic elements, technical analysis is only based on an asset's price charts. To anticipate future movements, all that is required is the recognition of patterns on a chart.
The ability to recognize price trend cues in a market is an important part of any trading strategy. All traders must devise a strategy for determining the optimal entry and exit points in a market, and using technical analysis tools is a popular technique for doing so.
Technical analysis software is now so widely utilized that many people believe it has established self-fulfilling trading rules: As more traders use the same indicators to find support and resistance levels, more buyers and sellers will congregate around the same price points, repeating the patterns.
In general, technical analysts look at the following broad types of indicators, formations, and theories:
- Price trends (trendlines, channels, Elliott Waves, Dow Theory)
- Chart patterns (double tops and bottoms, head and shoulders, triangles, wedges)
- Price action (pin bar, inside and outside bars, and different candlestick chart patterns like Doji candle)
- Trend following indicators (moving averages, Ichimoku, Parabolic SAR, ZigZag, ADX)
- Volatility indicators (Bollinger bands, ATR)
- Oscillators (RSI, MACD, CCI, Stochastic)
- Support and resistance levels (Fibonacci retracements, pivot points)
Visit NAGA Academy to learn more
Ethereum Price Prediction Using Market Sentiments
In finance, the term "sentiment" refers to a viewpoint or opinion about a market's condition. The sentiment of crypto market investors towards the asset is a description of their general emotions and attitudes. It reflects the collective psychology of all those involved in trading and developing cryptocurrency.
How investors feel about cryptocurrency can have a tangible impact on market cycles and the price. It can have serious implications if enough traders act on the ideas, thoughts, and feelings they share, regardless of whether they are based on real-world data. This is evident in how tweets by Elon Musk have impacted Bitcoin's price (a bullish sentiment).
For analyzing the sentiment of cryptocurrency markets, there are many statistics you can use. The following statistics provide vital information about the movement and trajectory of cryptocurrency assets: funding rates, sentiment indices, social media, community analysis, and whale monitoring.
The funding rates are the monthly payments that traders receive based on price differences between the spot price of currencies and tokens and the price difference between cryptocurrency perpetual contracts. Positive funding rates indicate a bullish market.
A sentiment index is used to predict whether investors will act fearfully or greedily. It can be affected by volatility, market momentum, and investor responses to surveys. A fearful market can be an opportunity to buy if it is managed correctly. Conversely, a greedy market means that it is a good moment to sell.
Another crucial aspect for assessing sentiment in crypto markets is the community’s activity on social media, especially Twitter and Telegram. Investors would look for an active social network with meaningful interaction across platforms.
Whale monitoring is the process of keeping an eye out for big crypto players. A cryptocurrency whale is an investor who holds large-value transactions on multiple blockchains. Whale watchers spot major market participants' trades and trade accordingly.
Ethereum Historical Prices
Ethereum was first introduced through an initial coin offering (ICO) in August 2014. The project raised over $16 million by selling 50 million ETHs at a price of $0.31 per coin. Ethereum has always closely followed Bitcoin’s price evolution, marking the 2017 and 2021 peaks with new all-time highs.
However, Ethereum's total supply can be increased, unlike Bitcoin or Litecoin, which can cause inflation. During the 2022 crypto crash, Ethereum’s price fell by over 66%, or even more at some points. But even after dropping under the $1,000 milestone, the coin rebounded.
The ETH coin price has been falling in recent months despite the approach of ‘The Merge’ as cryptocurrency markets have turned bearish, especially since the collapse of the TerraUSD stablecoin (UST) and its accompanying LUNA token in May.
The drop was felt throughout the entire crypto market and has also led to the bankruptcy of several crypto exchanges. The August enthusiasm and price rise were due to the news of the incoming transition to the PoS algorithm, which soon faded away. However, ETH was still struggling to maintain the $1,200 price by the end of 2022.
Ethereum largely remained in the background in 2023, as Bitcoin and numerous other cryptocurrencies experienced surges in popularity. ETH gained 80% during the year, testing the $2,500 level at the end of the year.
Bitcoin halving and Shapella/Dencun upgrades ignited a 120% rally, pushing ETH past $4,000 at the beginning of 2024, before the correction to $3,000. Spot ETF filings from BlackRock/VanEck fueled optimism, though SEC delays capped gains.
2025 proved explosive, with ETH new ATH around the $5,000, on spot ETF approvals ($50B AUM), Pectra upgrade staking surge (35M ETH locked), and L2 TVL explosion to $300B. Q4 macro volatility triggered a 35% pullback, but the $3,00 support held, at least at the time of this Ethereum forecast update, end of Jan 2026.
Ethereum Forecast & Price Prediction - Summary
To summarize the Ethereum price predictions for 2026, the largest altcoin is forecasted to outperform the broader crypto market, and for this reason, was recently included in the top 5 cryptocurrencies with the potential to explode. But that does not mean ETH is completely immune to bearish outcomes.
While an increase to $45,000 is possible, it is not certain since regulatory changes and unprecedented crashes plague the crypto market. Furthermore, considering the performance in 2025, ETH has not necessarily been the favorite asset of institutional investors. This lack of interest, if noted in 2026 as well, could act as a counter force on ETH's potential growth.
Thus, it is advised always to do your own research and make the most ETH-educated decision.
Sources:







The present domain / website, NAGA.eu is owned by Naga Technology GmbH, however is independently and exclusively operated by Axon Securities S.A., an AEPEY which is authorised and regulated by the Hellenic Capital Market Commission (HCMC) under licence No. 7/560/02.09.2010 and with registered address 48 Stadiou Street, 105 64 Athens, Greece.
NAGA is a trade name and trademark under the NAGA Group AG, a German based FinTech company publicly listed on the Frankfurt Stock Exchange | WKN: A161NR | ISIN: DE000A161NR7. Exclusive rights for the use of the said trade name and trademark, in the territory of Greece, are exclusively granted to Axon Securities S.A. In this respect and for the avoidance of doubt, any references in the present domain to "NAGA" refer just to the brand/trade name/trademark, the NAGA Platform or account and not to any specific company under NAGA Group of companies.
RESTRICTED JURISDICTIONS:With regards to the current website, Axon Securities S.A. offers services to Greek residents. Axon Securities S.A does not provide investment and ancillary services in the territories of third countries including Japan, Canada and the USA. For further details please refer to our Terms & Conditions.
HIGH RISK INVESTMENT WARNING:CFDs are complex instruments and come with a high risk of losing money rapidly due to leverage. Between 74-89% of retail investor accounts lose money when trading CFDs. You should consider whether you understand how CFDs work and whether you can afford to take the high risk of losing your money.
Trading through an online platform carries additional risks. Refer to our Regulation section here.