
- Home
- Blog
- Forecast and Price Predictions
- Euro to Dollar Forecast 2026–2027: EUR/USD Outlook and Predictions
Euro to Dollar Forecast 2026–2027: EUR/USD Outlook and Predictions

Updated October 16, 2026. Will the euro go up against the dollar? Not quickly, according to most banks: year-end forecasts published since August centre on 1.14–1.15, in a range of 1.10 to 1.20, and most see the recovery coming in 2027. Until then, the Fed’s hiking cycle and French political risk keep the pressure on, and the 1.11 area is the key long-term support to watch.
The EUR/USD opened 2026 as a consensus long trade, with several big banks forecasting 1.20–1.25 by year-end. Then the Strait of Hormuz conflict pushed energy prices and inflation higher on both sides of the Atlantic. The ECB raised rates in June and September, but the Fed answered with its first hike since 2023 on September 16 — and since then the dollar has had the upper hand.
The pair broke decisively below the 1.14 support in late September, after two failed breaks in June and July, and it is now testing a cluster of long-term supports near 1.11. With the Fed and the ECB both hiking, the rate gap between them has not narrowed — it is still 1.50 percentage points — and France’s fiscal and political troubles have added a risk premium to the euro. Here is the full updated EUR/USD forecast for Q4 2026, 2027 and beyond.
“The long-term trend in the US dollar remains constructive, although the recent move has become stretched and a temporary correction should not be ruled out,” says Frank Walbaum, Market Analyst at NAGA and a former hedge fund manager, in his Q4 2026 Market Outlook. For EUR/USD, that means the medium-term pressure is still on the downside, but a relief rally is possible: in his view, weaker US data could trigger a temporary dollar correction.
EUR/USD Forecast 2026 — Key Notes
- Euro to US Dollar price prediction for the next 6 months: EUR/USD has fallen from 1.2081 in January to the 1.11–1.13 area in October, as the Fed’s September hike and French fiscal stress outweighed the ECB’s own hikes. The next six months hinge on three things: how far the Fed goes (decisions on October 28 and December 9), whether French bond spreads stabilise, and whether the 1.11 support area holds.
- BASE CASE (~50%) — 1.10 – 1.16: The Fed hikes once more in December and the ECB matches it, so the rate gap stays roughly where it is. EUR/USD holds the 1.10–1.11 support area and trades in a 1.10–1.16 range — in line with most bank year-end forecasts (median about 1.14–1.15) and the Reuters poll’s 1.15 at three and six months.
- BULL CASE (~25%) — 1.16 – 1.20: US data cool, the Fed stops after December, and the ECB keeps hiking into 2027 while French spreads narrow. EUR/USD reclaims 1.14 and the 50-week average near 1.16, and the recovery most banks expect for 2027 — MUFG sees 1.18 by Q3 2027, Bank of America 1.20 by end-2027 — starts early.
- BEAR CASE (~25%) — 1.06 – 1.10: US inflation stays hot, the Fed hikes more than once, and French political risk escalates ahead of the April 2027 presidential election. EUR/USD breaks below the 200-week average near 1.11 and heads for the 1.07–1.08 zone, where the measured target of the 2025–26 top meets the long-term channel floor. Nordea already expects a test of 1.08 in the first half of 2027.
Note: These are illustrative scenarios only, not price targets or investment recommendations. Actual outcomes may differ materially.
- EUR/USD Forecast 2027: Most banks expect the euro to recover in 2027 as US rate hikes peak and French political risk fades: MUFG sees 1.18 by Q3 2027, Bank of America 1.20 by end-2027 and Westpac 1.21 by December 2027. A bearish minority sees lower levels first — Nordea expects a test of 1.08 in the first half of 2027 and RBC Capital Markets 1.10 through 2027.
- EUR/USD 5-Year Forecast (2027–2030+): Few banks publish forecasts beyond 2027. Nordea sees 1.20 by end-2028 and Westpac 1.22 by mid-2028, and Danske Bank puts purchasing-power-parity fair value near 1.25 over three to five years. The long-term case for the euro rests on US fiscal deficits, reserve diversification and the eurozone’s fiscal capacity; the risks are slower European growth and political fragmentation.
Trade EUR/USD with NAGA: Speculate on EUR/USD price movements through CFDs — long or short, with tight spreads.
EUR/USD Fundamental Analysis 2026
Both central banks are now hiking, but the Fed is ahead where it matters for the currency. The ECB raised its deposit rate to 2.25% in June and to 2.50% on September 10; the Fed answered with its first hike since 2023 on September 16, taking its target range to 3.75–4.00%, and its new projections point to one more increase this year. The gap between the two policy rates is still 1.50 percentage points — the same as in June.
ECB Interest Rates vs the Fed — Both Hiking, the Fed Ahead
European Central Bank
2.50%
Hiked Sep 10 — second hike of 2026, unanimous
Euro-area inflation rose to 3.8% in September (flash; energy +18.8%, core 2.5%). Staff now project inflation of 3.0% in 2026 and 2.5% in 2027, and growth of 0.9% this year. Markets expect a hold on October 29 and about 23bp of hikes by December. Next decision: October 29, 2026.Federal Reserve
3.75–4.00%
Hiked Sep 16 — first hike since 2023 (12–0)
US inflation eased to 3.7% in September from 4.2% in May, but core prices rose faster than expected. 16 of 18 officials expect at least one more hike this year, and the minutes judge inflation risks “skewed to the upside.” A December hike is fully priced. Next decision: October 28, 2026.
The rate gap was widest in late 2022 and early 2023, when the Fed hiked faster than the ECB: about 2.5 percentage points, briefly 3.0 in December 2022. It narrowed to 1.5 as the ECB caught up in 2023, widened back to 2.5 in mid-2025 as the ECB cut faster, and stood at 1.75 at the start of 2026. The ECB’s June hike took it to 1.50, and because the ECB’s September 10 hike was followed by the Fed’s on September 16, it is still 1.50 — the Fed’s 4.00% upper bound against the ECB’s 2.50% deposit rate.
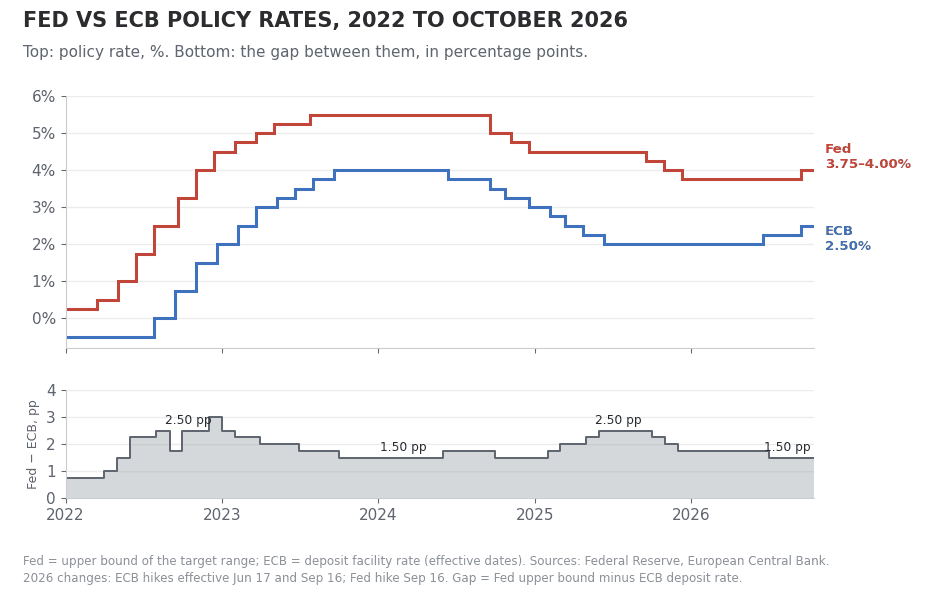
The bull case for EUR/USD still rests on that gap closing — the Fed eventually cutting while the ECB holds or keeps hiking. For now, markets expect both banks to hike once more by December, which leaves the gap where it is. Meanwhile the US 10-year Treasury yield hit 5.04% on September 23, the highest since 2007, keeping dollar assets attractive, and the ECB’s staff expect inflation to fall back toward 2% by 2028, which limits how far it is likely to go.
Inflation — The Common Enemy Driving Both Banks
The Strait of Hormuz conflict, which began in late February, remains the main source of inflation on both sides of the Atlantic. Brent crude traded around $105–107 in mid-October and European gas near €86 per megawatt-hour, close to a four-year high, as attacks on tankers in the strait surged. Euro-area inflation rose to 3.8% in September (flash), with energy prices up 18.8%; US inflation eased to 3.7% from 4.2% in May, though core prices rose faster than expected.
That split matters for the rate path. The euro area imports most of its energy, so its inflation is more exposed to the war — but so is its growth, which keeps the ECB cautious about how far to go. “We are not pre-committing to a particular rate path,” ECB President Christine Lagarde said after the September hike. The Fed has fewer doubts: minutes of its September meeting show most officials expect another increase by year-end and judge inflation risks “skewed to the upside.”
Growth Has Held Up, but France’s Debt Is the New Risk
The euro-area economy has proved sturdier than feared. First-quarter GDP, estimated in June as a 0.2% contraction, has since been revised to flat, and growth picked up to 0.6% in the second quarter, the strongest since 2022. The September flash composite PMI rose to 53.1, and ECB staff now project 0.9% growth this year. Germany’s fiscal expansion — a €500 billion infrastructure fund and a debt-brake exemption for most defence spending — is feeding into budgets, with net borrowing of about €204 billion planned for 2027.
The new risk is France. Prime Minister Sébastien Lecornu’s 2027 budget, presented on October 1, plans about €54 billion of savings to cut the deficit to 5% of GDP, but his government has no majority and a presidential election is due in spring 2027. The French 10-year yield hit 4.95%, the highest since 2002, and its gap over German Bunds widened to about 150 basis points on October 2, the widest in more than a decade. “Latest bond market dynamics are increasingly concerning and somewhat reminiscent of a sovereign debt crisis,” Commerzbank strategist Hauke Siemssen said on October 5. Moody’s reviews France’s Aa3 rating on October 23.
Geopolitics — The Iran War and Energy Prices
The Iran war remains the biggest swing factor for EUR/USD. The April ceasefire, which lifted the euro to 1.1849 on April 17, did not last: US–Iran talks planned for June 19 in Switzerland were called off, the truce collapsed in early July, and attacks on tankers in the Strait of Hormuz surged in October, with no direct talks under way. A durable ceasefire that reopens the strait would ease energy prices and help the euro more than the dollar, because the euro area imports most of its energy; a further escalation would do the opposite.
EUR/USD Technical Analysis
On the weekly and monthly charts, EUR/USD is in a medium-term downtrend inside a longer-term uptrend. The pair has made lower highs since the 1.2081 peak on January 27, and the 2025–26 top completed when it closed below 1.14 and 1.13 in late September and early October. But it is now testing the 1.11 area, where several long-term supports meet. Levels below are based on the October 15 close and are meant for a horizon of weeks to months, not days.
The Long-Term Ascending Channel (2022–2026)
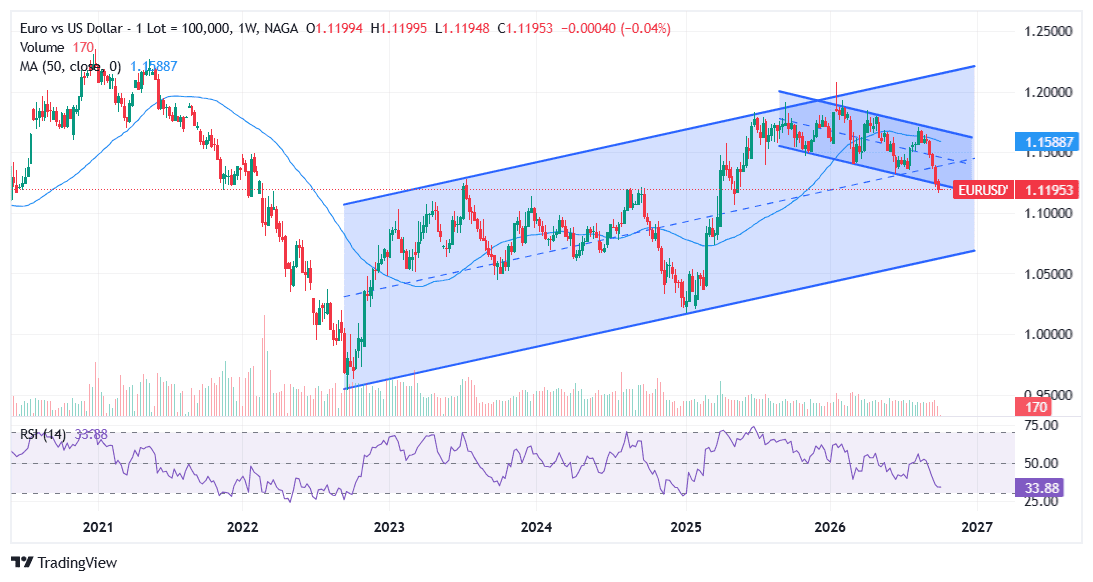
EUR/USD has traded inside a broad ascending channel since the September 2022 parity-crisis low at 0.9535. The lower rail runs through that low and the January 2025 low at 1.0178, and now sits near 1.067, rising to about 1.073 by year-end. The upper rail, drawn parallel through the July 2023 high, is near 1.22 — close to where the January 2026 rally ran out of steam at 1.2081.
The channel midline, near 1.143, acted as support for most of 2026 and gave way in late September. EUR/USD now trades in the lower half of the channel. Within this framework the decline is a correction: the multi-year uptrend survives as long as the floor holds, but there is room to fall further before it is tested. A shorter descending channel, drawn from the January and August 2026 highs, points the same way — its lower boundary near 1.112 was touched by the October 14 low.
Past performance is not a reliable indicator of future results. All historical data, including but not limited to returns, volatility, and other performance metrics, should not be construed as a guarantee of future performance.
The 2025–26 Top Has Completed — Target Near 1.07–1.08
Earlier this year, this analysis flagged a possible triple top between 1.18 and 1.20. With the peaks now set at 1.1919 (September 2025), 1.2081 (January 27, 2026) and 1.1849 (April 17, 2026), the pattern reads more like a head-and-shoulders top, because the middle peak is clearly the highest. Continuum Economics warned in March that a break lower would complete a “multi-month distribution top beneath the 1.2083 current year high of 27 January.”
The neckline runs through the November 2025 low (1.1469) and the March 13 low (1.1411), and sits near 1.13–1.14. Two earlier breaks failed: weekly closes of 1.1383 on June 26 and 1.1371 on July 24 were followed by a rally to 1.1711 in August. The third break held — a weekly close of 1.1391 on September 25, the June low of 1.1325 broken on September 29, and the first weekly close below 1.13 on October 2. The height of the pattern, about 6.5 cents from the head to the neckline, projects a measured target near 1.07–1.08.
That target sits just above the ascending channel’s floor, which rises to about 1.073 by year-end, so the two long-term structures now point to the same zone. In other words, the completed top does not by itself break the multi-year uptrend. It implies a deeper correction toward the channel floor if the support near 1.11 gives way.
The case for the bulls is the 1.11 area. The 50% retracement of the January 2025–January 2026 rally (1.1130), the 38.2% retracement of the whole 2022–2026 advance (1.1108) and the 200-week moving average (about 1.110, still rising) all cluster there, and the October 14 low at 1.1113 held it. As long as weekly closes stay above that zone, the decline remains a correction within the multi-year uptrend; a monthly close below it would be the first sign that the up-cycle is failing.
Weekly Moving Averages and Momentum
The long moving averages confirm the medium-term downtrend. EUR/USD trades below its 50-week average (about 1.159, falling since late May) and closed below its 100-week average (about 1.137) on October 2 for the first time this year. On the daily chart, the 50-day average crossed below the 200-day in mid-April and has stayed there. Only the 200-week average, near 1.110, is still below the price.
Momentum is weak but stretched. The weekly RSI is about 35, close to the sub-30 readings that marked the November 2024 and January 2025 lows, and the weekly MACD has been below zero since June. On the monthly chart, RSI is neutral near 47 and the pair is testing its 100-month average (about 1.119), so the long-term trend is being tested rather than broken. “Technicals are stretched but a deeper drop cannot be ruled out in 4Q,” Société Générale noted on September 25.
What would change the picture: a weekly close back above 1.14, the old neckline, would neutralise the top and reopen 1.16. A weekly close below the 200-week average near 1.11 would open 1.10 and then the 1.07–1.08 target zone.
The dollar side of the chart matters just as much, because the euro makes up about 58% of the US dollar index (DXY). In his Q4 2026 Market Outlook, Frank Walbaum writes: “A sustained break above 102.50 in the DXY would strengthen the bullish case and could open the door for further upside.” The index reached that area in early and mid-October, its highest in roughly 18 months, but has not held above it and eased below 102 by October 16 — so 102.50 on the DXY and 1.11 on EUR/USD are two sides of the same test.
Key Technical Levels
LEVEL RATE SIGNIFICANCE 2026 High / Channel Upper Rail 1.2081 – 1.22 January 27 high (the head of the 2025–26 top) and the 2022–26 channel’s upper rail; a weekly close back above 1.2081 would revive the long-term bull case 2026 Lower Highs 1.1711 – 1.1849 April 17 (1.1849) and August 21 (1.1711) highs; reclaiming them would end the run of lower highs since January 50-Week / 200-Day Averages ~1.159 Medium-term trend filters; both are falling, and the pair has closed above the 50-week average only once since June (August 21) Former Neckline Zone (Now Resistance) 1.1325 – 1.1470 Neckline (November 2025 low 1.1469, March 13 low 1.1411), the June 24 low (1.1325) and the 100-week average (~1.137); old support that should now act as resistance — Société Générale says 1.14 must be regained to shift the outlook Long-Term Support Cluster 1.1100 – 1.1130 50% retracement of the 2025–26 rally (1.1130), 38.2% of the 2022–26 advance (1.1108), the 200-week average (~1.110) and the October 14 low (1.1113) Pattern Target / Channel Floor ~1.067 – 1.08 Measured target of the 2025–26 top (≈1.07–1.08), 50% retracement of 2022–26 (1.0808) and the ascending channel floor (~1.067, ~1.073 by year-end) Past performance is not a reliable indicator of future results. Technical levels are analytical reference points, not guaranteed price targets.
Learn more about technical analysis tools at NAGA Academy.
EUR/USD Forecast 2026–2027 — Institution Predictions
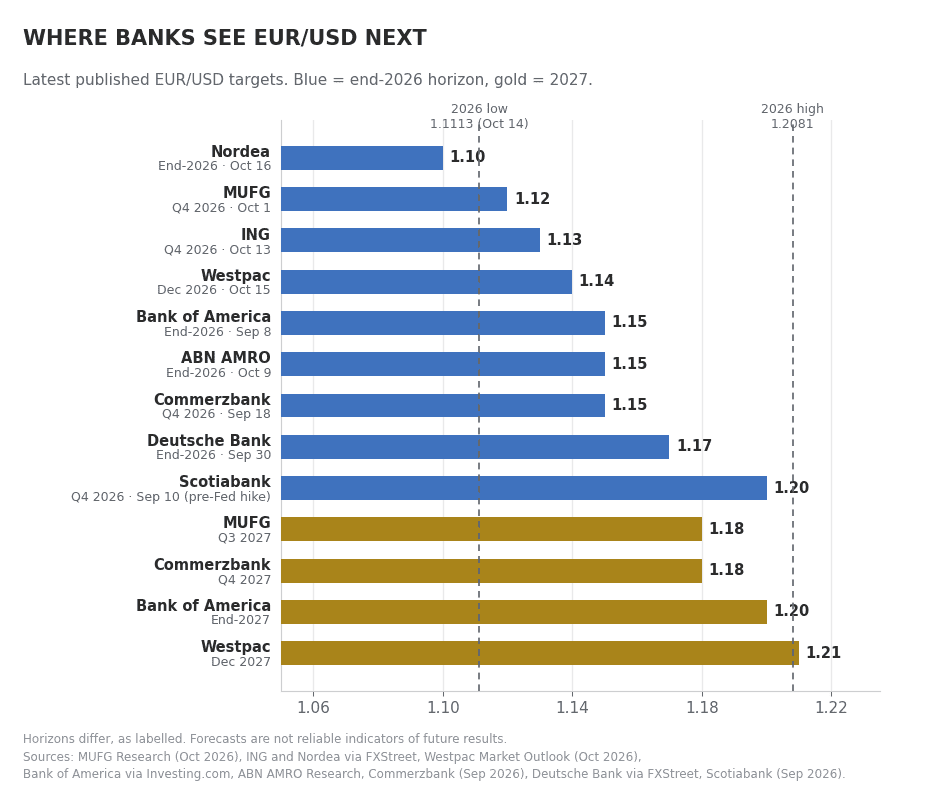
Banks have cut their EUR/USD forecasts hard since the summer. Ten year-end forecasts published between August and October range from 1.10 (Nordea) to 1.20 (Scotiabank, before the Fed’s hike), with a median of about 1.14–1.15, and most banks expect the euro to recover in 2027. Here is the full EUR/USD forecast from banks, as of October 16, 2026.
INSTITUTION LATEST TARGET BIAS KEY DRIVER / CAVEAT Goldman Sachs 1.14 (3 months) → 1.12 (6–12 months) Bearish Cut on July 7 from 1.18/1.20 (3-month 1.14 restated October 12): “we are unlikely to return to broad-based, sustained Dollar depreciation for some time.” Deutsche Bank 1.17 (end-2026) Range-bound Sees a 1.13–1.20 range for the year: “this is the wrong time to be chasing EUR/USD lower” (September 30). Wealth arm: 1.19 by March 2027. MUFG 1.12 (Q4 2026) → 1.18 (Q3 2027) Bearish now, bullish 2027 Cut from 1.18 on October 1 (Fed hike, energy prices, French risk); expects a recovery in 2027 as political risks recede. Scotiabank 1.20 (end-2026) Most bullish Published September 10, before the Fed’s hike; its October 13 note puts fair value near 1.1250. J.P. Morgan 1.14 (Dec 2026) → 1.13 (Mar 2027) Bearish (June call) Cut from 1.20 on June 16 on Fed repricing and the energy shock; no public update since. ING 1.13 (Q4 2026 and Q1 2027) Bearish Cut from 1.18 (August): “A test of 1.110 remains the risk for EUR/USD” (October 13). Sees a France risk premium in the euro. Nordea 1.10 (end-2026) → 1.20 (end-2028) Most bearish Cut from 1.14 on October 16; expects a test of 1.08 in H1 2027 before a recovery. Bank of America 1.15 (end-2026) → 1.20 (end-2027) Neutral Dollar to end the year near current levels, then modest depreciation in 2027. Westpac 1.14 (Dec 2026) → 1.21 (Dec 2027) Bullish 2027 Expects only one more Fed hike against the three markets price. ABN AMRO 1.15 (end-2026) Neutral “Downside in EUR/USD is protected but the upside is constrained” (October 1); markets price too many Fed and ECB hikes. Commerzbank 1.15 (Q4 2026) → 1.18 (Q4 2027) Neutral (Sep view) Forecast table of September 18; its October 15 note says risks are “tilted to the downside”. Reuters FX poll (median) 1.15 (3–6 months) → 1.16 (12 months) Neutral About 70 forecasters, September 30–October 2; down from 1.20 (12 months) in June.
One caveat: several of these forecasts were published before the Fed’s September 16 hike or the sharpest moves in French bond spreads, and spot EUR/USD already trades below most year-end targets. The direction of revisions since June has been one way — lower — so the next round, after the October 28–29 Fed and ECB meetings, is more likely to bring further cuts than upgrades.
The 2027 picture is different. Most banks still expect the dollar to weaken once the Fed stops hiking and French political risk fades after the April 2027 election: MUFG, Commerzbank, Bank of America and Westpac all see 1.18–1.21 by late 2027. That gap between a weak near-term outlook and a firmer 2027 is the main message from the bank forecasts.
AI-Based EUR/USD Forecasts — What the Algorithms Say
Algorithmic and AI-driven forecasting models for EUR/USD show a notably tighter range than the bank consensus, largely because most were trained on historical patterns that favour mean-reversion toward the pair's long-run average — and are therefore structurally cautious about both the most bullish bank targets and the most bearish scenarios.
MODEL 2026 RANGE / YEAR-END 2027 TARGET BIAS & NOTES CoinCodex 1.08–1.13; year-end 1.08 0.9669 (Dec 2027 average; range 0.9518–0.9890) Bearish — the most bearish model. Projects a fall of about 14% from current levels, below parity by December 2027, although its own technical gauge reads neutral (54% bullish / 46% bearish). Snapshot: October 19, 2026. LongForecast 1.080–1.124 in December; year-end 1.096 1.089 (Dec 2027 close; 2027 range 1.060–1.132) Moderately bearish. Projects EUR/USD easing from 1.1227 to around 1.08–1.10 and staying there through 2027. Snapshot: October 18, 2026. TradersUnion (statistical) 1.0538–1.0968 in December; average 1.0753 1.088 (end-2027; mid-year 1.0938) Bearish. Statistical model, recalculated daily, that sees EUR/USD below the current 1.121 at the end of both 2026 and 2027. Snapshot: October 19, 2026. WalletInvestor 1.12 in December; 1-year range 1.08–1.20 ~1.14 (October 2027, +1.30%) Neutral — the only model with modest upside: +1.30% over the next year, within a wide 1.08–1.20 range; overall verdict “Hold”. Snapshot: October 19, 2026.
The pattern across AI models is consistent and instructive: where bank forecasters build a structural narrative (rate differentials, fiscal flows, reserve diversification) and project a destination, algorithmic models tend to extrapolate recent price action and revert toward the historical mean, producing more conservative and often contradictory near-term projections.
In June, LongForecast’s model projected weakness to about 1.11–1.12 by late 2026 — roughly where EUR/USD trades in October. It is a reminder that momentum models can get the direction right even when they do not model the Fed, the ECB or French politics.
AI and algorithmic forecasting models are based on historical data patterns and should not be used as the sole basis for trading decisions. Past performance and algorithmic projections are not reliable indicators of future results.
EUR/USD Price History — Key Moments
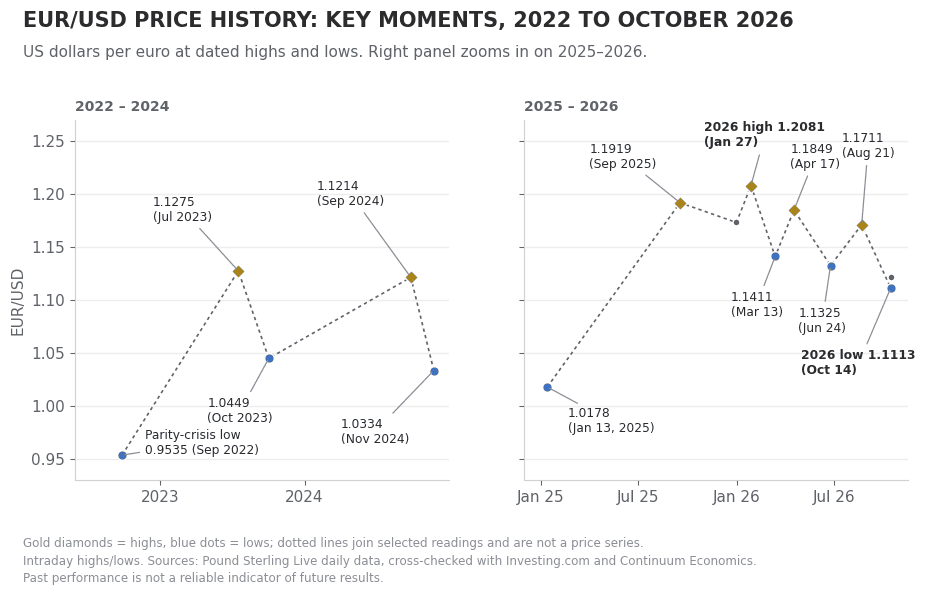
The EUR/USD pair has had one of the most volatile multi-year stretches in its history since 2022, starting from a crisis below parity and recovering more than 25 figures (2,500 pips) to its 2026 high, before falling back to the 1.11 area in October.
September 2022: The Parity Crisis Low (0.9535)
EUR/USD reached its lowest point since 2002 in September 2022, touching 0.9535 as the Federal Reserve's aggressive rate-hiking campaign pushed the dollar to multi-decade highs against virtually every major currency. The eurozone faced a simultaneous energy crisis triggered by Russia's invasion of Ukraine, with natural gas prices spiking to historic highs and German industrial output contracting sharply. This combination — a hawkish Fed with a rate advantage of about 250bp and a eurozone facing a recessionary energy shock — drove the pair to a level few had thought possible even a year earlier.
2023–2024: Recovery as the Fed–ECB Gap Narrowed
EUR/USD recovered steadily through 2023 and 2024 as the ECB's own aggressive hiking cycle (which ultimately took rates to 4.0%) closed the gap with the Fed, and as European energy markets normalised after the initial Russia shock. The pair reached 1.1275 in July 2023, pulled back sharply in autumn 2023 when Fed rate-cut hopes were dashed, and the dollar strengthened again, rallied to 1.1214 in September 2024 as both central banks began cutting, then fell to 1.0334 in November as the dollar strengthened into year-end.
2025: The Dollar's Biggest Annual Decline Since 2017
The US dollar fell about 9.5% on a DXY basis in 2025 — its largest annual decline since the first year of Trump's first term — as the Fed cut three times (75bp total to 3.50–3.75%) while the ECB continued its easing path. EUR/USD rode this dollar weakness from about 1.035 at the start of 2025 to 1.1732 at year-end, a gain of about 13%, touching an intraday high of 1.1919 on September 17. The pair entered 2026 near 1.173 — its strongest year-open since 2021.
January 27, 2026: The 1.2081 High
EUR/USD crossed 1.20 for the first time since mid-2021 on January 27, 2026, touching an intraday high of 1.2081, driven by expectations that the Fed would continue cutting rates in 2026 while the ECB held. German fiscal expansion (a €500 billion infrastructure fund and looser rules for defence spending) and foreign capital returning to European equity and bond markets provided additional tailwinds. The move did not hold: the pair closed back below 1.20 the next day, and the January peak became the high point of the 2025–26 top.
March 2026: The Hormuz Shock Low (1.1411)
The Strait of Hormuz conflict, which began in late February, drove EUR/USD to a low of 1.1411 on March 13, in a risk-off episode that simultaneously strengthened the dollar as a safe-haven currency and weighed on the euro's growth-sensitive profile. The pair recovered after the two-week ceasefire announced on April 7, breaking back above 1.16 the next day and reaching 1.1849 on April 17 — a rally that became the right shoulder of the 2025–26 top.
June 2026: The Dual Central Bank Pivot
The ECB hiked 25bp to 2.25% on June 11 — its first hike since 2023 — but the Fed’s hawkish hold on June 17, with nine of eighteen officials projecting a hike this year, pushed the dollar higher. The cancellation of US–Iran talks in Switzerland on June 19 added to the pressure, and EUR/USD fell to 1.1325 on June 24, its lowest level of the first half.
July–October 2026: The Fed Hike Breaks the 1.14 Floor
The euro recovered over the summer and reached 1.1711 on August 21, but the rally stalled below the April high. The ECB hiked again to 2.50% on September 10, yet the Fed’s first hike since 2023 on September 16 and US 10-year yields above 5% sent EUR/USD through the June low on September 29, and French fiscal stress around the October 1 budget added to the pressure. Hot US inflation data on October 14 pushed it to 1.1113, the lowest since May 2025, before a rebound to about 1.12.
It is worth keeping in mind that both analysts and online forecasting sites can and do get their predictions wrong. Keep in mind that past performance and forecasts are not reliable indicators of future returns. When considering EURUSD price predictions for 2026 and beyond, it’s important to keep in mind that high market volatility and the macroeconomic environment make it difficult to produce accurate long-term EURUSD analyses and estimates. As such, analysts and forecasters can get their EURUSD forecast wrong.
It is essential to do your research and always remember that your decision to trade depends on your attitude to risk, your expertise in the market, the spread of your investment portfolio, and how comfortable you feel about losing money. You should never invest money that you cannot afford to lose.
Sources:
- Trading Economics — EUR/USD Historical Data
- J.P. Morgan Global Research — 2026 Market Outlook
- FX Empire — EURUSD Forecast 2026
- European Central Bank — Monetary policy statement, September 10, 2026
- European Central Bank — Key ECB interest rates
- Federal Reserve — FOMC statement, September 16, 2026
- Federal Reserve — Minutes of the FOMC, September 15–16, 2026
- MUFG Research — Monthly Foreign Exchange Outlook, October 2026
- J.P. Morgan Global Research — Currency Volatility: Dollar Strength, Euro Weakness? (June 2026)
- FXStreet — Euro: Lower year-end target at 1.13 against US Dollar (ING), October 13, 2026
- Westpac — Market Outlook, October 2026
- Reuters via Business Day — Why the euro is at a 17-month low, October 5, 2026
- Pound Sterling Live — Euro to US Dollar history, 2026
Other Resources:
- NASDAQ 100 forecast & price predictions 2026
- DAX 40 forecast & price predictions 2026
- Gold forecast & price predictions 2026
- Silver forecast & price predictions 2026
- Oil forecast & price predictions 2026
- Natural gas forecast & price predictions 2026
- Dow Jones forecast & price predictions 2026
- How to trade forex
- Technical analysis academy guide
- Fundamental analysis — what moves FX




The present domain / website, NAGA.eu is owned by Naga Technology GmbH, however is independently and exclusively operated by Axon Securities S.A., an AEPEY which is authorised and regulated by the Hellenic Capital Market Commission (HCMC) under licence No. 7/560/02.09.2010 and with registered address 48 Stadiou Street, 105 64 Athens, Greece.
NAGA is a trade name and trademark under the NAGA Group AG, a German based FinTech company publicly listed on the Frankfurt Stock Exchange | WKN: A161NR | ISIN: DE000A161NR7. Exclusive rights for the use of the said trade name and trademark, in the territory of Greece, are exclusively granted to Axon Securities S.A. In this respect and for the avoidance of doubt, any references in the present domain to "NAGA" refer just to the brand/trade name/trademark, the NAGA Platform or account and not to any specific company under NAGA Group of companies.
RESTRICTED JURISDICTIONS:With regards to the current website, Axon Securities S.A. offers services to Greek residents. Axon Securities S.A does not provide investment and ancillary services in the territories of third countries including Japan, Canada and the USA. For further details please refer to our Terms & Conditions.
HIGH RISK INVESTMENT WARNING:CFDs are complex instruments and come with a high risk of losing money rapidly due to leverage. Between 74-89% of retail investor accounts lose money when trading CFDs. You should consider whether you understand how CFDs work and whether you can afford to take the high risk of losing your money.
Trading through an online platform carries additional risks. Refer to our Regulation section here.