
- Home
- Blog
- Forecast and Price Predictions
- NASDAQ 100 Forecast & Price Predictions 2026: Breakout towards 28,000?
NASDAQ 100 Forecast & Price Predictions 2026: Breakout towards 28,000?

The NASDAQ-100 is trading above 25,000 points at the beginning of 2026, continuing its solid uptrend started in 2023. The technology sector navigated headwinds like high inflation, elevated interest rates, and considerable macroeconomic including Trump's tariffs and global uncertainties, gaining 21% in 2025.
It briefly dropped into bear market territory last year when President Trump began imposing tariffs, but the technology-heavy index quickly entered a new bull market due to persistent excitement about artificial intelligence.
Since 1990, the Nasdaq has been through six other bull markets. The average one lasted for five years, during which the index returned 31% annually. That drives bullish NASDAQ100 forecast and price predictions for 2026.
NASDAQ-100 Forecast & Price Predictions Summary
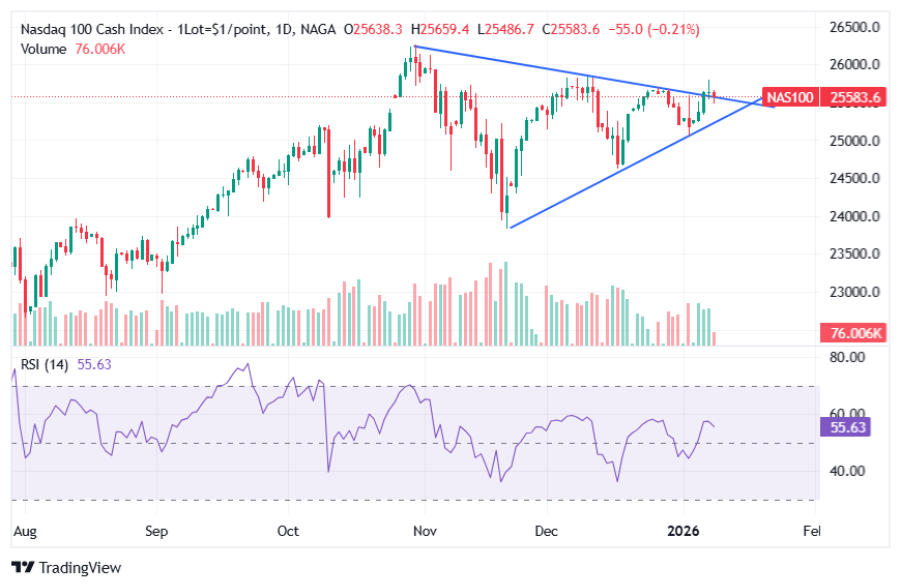
- Nasdaq-100 forecast Q1 2026: The chart pattern displays a symmetrical triangle, signalling another leg up towards the 28,000 points. If a breakout is not confirmed, the price is expected to trade within the 24,000-26,000 points range.
- Nasdaq-100 price predictions 2026: Strategists forecast the NASDAQ 100 index to gain 7-12% in 2026, banking on steady AI flows and no profit cliffs. Upside skews firm, though slowdowns or CapEx peaks could sour sentiment quickly—risks that feel distant for now.
- Nasdaq-100 forecast for the next 5 years: AI has become the hottest word on Wall Street since 2023 and will remain a megatrend that won’t be going away anytime soon according to experts from IBM. The five-year projection showed the index above 30,000.
With NAGA, you can trade the NASDAQ Index directly, trade or invest in NASDAQ 100 ETFs, and trade or invest in NASDAQ 100 components.
Fundamental Nasdaq-100 Forecast 2026
Tech earnings are poised to pick up steam in 2026, fueled by unrelenting AI spending that keeps dominating boardroom budgets. Cloud services, chipmakers, and software outfits should post solid double-digit sales jumps, even if the blistering pace from 2024-25 eases off a bit—which was inevitable after such a wild run. The real story is the sustained momentum: firms keep pouring cash into AI setups, padding revenues for those best equipped to grab market share, marking a healthy reset rather than any real stumble.
What counts is that AI hunger stays voracious across the board. Companies aren't backing off; they're doubling down on infrastructure, turning capex into real top-line wins for key players. This normalization just weeds out the unsustainable hype, leaving room for genuine, broad-based expansion that feels more durable heading into the new year.
Rate cuts boost valuations
Fed rate trimming through 2026 offers a lift to pricey growth names, as softening job data prompts easier policy and compresses discount rates. Tech's long-duration profile thrives here, positioning the Nasdaq 100 ahead of peers amid this rare blend of AI tailwinds and looser money—echoing past cycles where falling rates supercharged tech surges.
That said, history shows these setups pack punch, but only if inflation cooperates. Central banks could pivot if prices stick, clipping the upside. Still, the Nasdaq looks primed to capitalize, blending structural shifts with policy grease for what could be another standout run.
AI gains spread wider
AI leadership is evolving beyond the mega-cap giants that hogged early spotlight, now pulling in chip gear suppliers, data center builders, cyber defenders, and automation plays. This shift dilutes concentration worries from prior booms, where a few names shouldered all the gains and left rallies fragile.
Wider participation signals deeper conviction in the trend, sustaining momentum as more firms ride the wave. Unlike narrow advances prone to stumbles, this broader lift-up hints at robust fundamentals propping a healthier market, less vulnerable to single-stock drama.
Margins improve amid CapEx
Profit margins face less squeeze thanks to robust pricing leverage, cautious headcount adds, and early AI-driven efficiencies trimming labor costs. Automation's bottom-line impact is kicking in, as routine tasks go machine-led, offsetting some spending pressures.
CapEx stays heavy for semis and data ops fueling AI, crimping free cash for now—but winners with deep pockets can weather it. This shakes out weaker rivals, rewarding balance-sheet fortresses and setting up superior returns long-term for those who invest boldly.
Regulation as wild card
Regulatory heat on cloud giants and AI tech ramps up in the US and EU, with antitrust probes potentially scrambling the field. Tech's track record shows savvy navigation of such hurdles, suggesting limited lasting damage to the spend cycle.
Demand's raw force should overpower enforcement drags, as watchdogs hesitate to choke innovation. Yet vigilance pays, tougher crackdowns might hit mega-caps hardest, prompting selective tweaks to stay ahead of the curve.
Technical NASDAQ-100 Forecast 2026
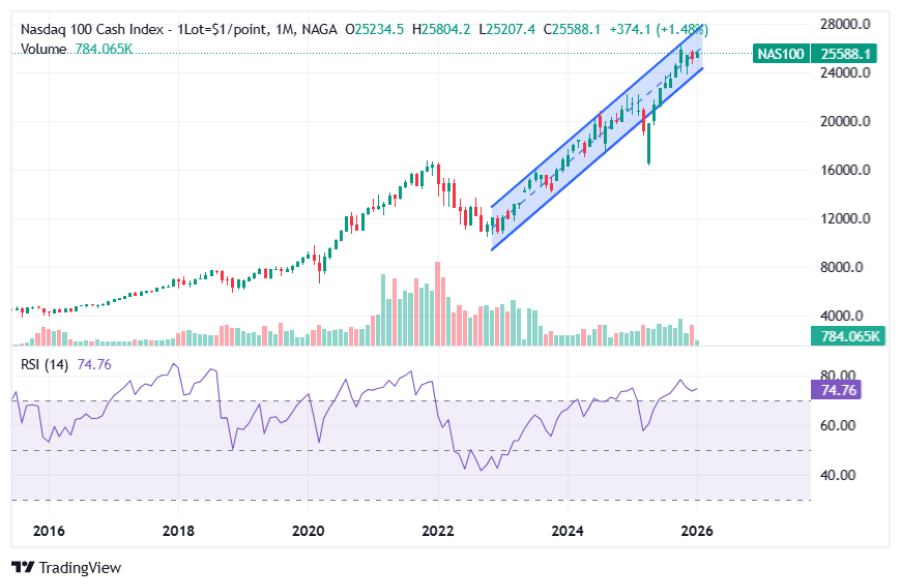
The index’s dip to below 16,000 during the Liberation Day selloff provided the dip for an almighty rally, which has taken the index to fresh record highs. The longer-term trend is stubbornly intact. Bubble fears have failed to dislodge it, and recent weakness found support at 24,000.
Past performance is not a reliable indicator of future results. All historical data, including but not limited to returns, volatility, and other performance metrics, should not be construed as a guarantee of future performance.
The index has not endured a substantial pullback since April, so going into 2026 it makes sense to be prepared for some volatility. For example, a drop back to 23,000 would feel dramatic, though it would likely prove to be another higher low. Too much energy has been wasted calling a top in this index, and with earnings growth so strong the fundamentals and technicals continue to align.
Sideways market in the medium term
Over recent months, the Nasdaq has traded within a well-defined sideways range or symmetrical triangle pattern, capped near 26,054 points and supported around 24,112 points. Until a clear breakout occurs, confirming a sustained bullish trend may remain challenging. However, the fifth wave was completed and the price bounced, indicating a more likely bullish continuation.
Past performance is not a reliable indicator of future results. All historical data, including but not limited to returns, volatility, and other performance metrics, should not be construed as a guarantee of future performance.
Indicators neutral to overbought
The RSI has remained consistently above the neutral 50 level, indicating that buying momentum has started to gain relevance. If the indicator continues to advance, it could further reinforce bullish pressure in Nasdaq price action over the short term.
By contrast, the MACD continues to show a histogram oscillating around the neutral zero line, suggesting that neutrality remains dominant in short-term moving average momentum. Unless the histogram begins to expand decisively, this behavior may signal a phase of price indecision in the near term.
Key support and resistance levels
Key Levels:
- 26,000 points – Key resistance: A level that aligns with the Nasdaq’s all-time highs and represents the most important upside barrier to monitor. A sustained move above this zone could activate a more consistent bullish NASDAQ100 forecast and pave the way for a rally during Q1.
- 25,000 points – Nearby barrier: A neutrality level corresponding to the midpoint of the current sideways range. Price action around this area could reinforce indecision and extend the consolidation.
- 24,000 points – Key support: A level corresponding to lows not seen since November 2025. Selling pressure toward this area could activate a dominant bearish bias over the coming weeks.
Institutional NASDAQ-100 forecast 2026
While some analysts highlight the resilience of companies and the market's capacity to handle challenges, others caution about the uncertainty in the economic outlook and possible volatility. Overall, there is a positive NASDAQ-100 forecast for 2026, accompanied by advice to closely monitor critical factors such as AI progress, interest rates, and economic indicators.
Bank of America forecasts modest NASDAQ 100 upside in 2026, implying around 4% gains tied to S&P 500's 7,100 target, as AI capex diverts from buybacks and liquidity dries up, though robust earnings provide a floor amid tech concentration risks.
Morgan Stanley predicts NASDAQ 100 strength to 7,800 equivalent on S&P terms (14% rise), driven by AI spending and cyclical recovery broadening participation beyond mega-caps, with favorable valuations relative to growth prospects.
Deutsche Bank calls for the most aggressive advance to 8,000 S&P level (17% upside), betting on stellar earnings, higher dividend payouts, and subdued inflation lifting tech-heavy indices like NASDAQ 100 higher still.
JPMorgan eyes 7,500 S&P (10% gain), translating to solid NASDAQ 100 performance on 13-15% EPS from the AI supercycle, though policy uncertainties temper enthusiasm for outsized tech rallies.
Goldman Sachs anticipates NASDAQ 100 momentum into late 2026 at 7,600 S&P equivalent (11% up), supported by sturdy global growth at 2.8% and US outperformance fueling sustained AI investment flows.
How to Trade Big Tech Stocks
You can trade Big Tech stocks and the Nasdaq 100 with NAGA.com in just four easy steps:
- Open a Trade account or log in if you’re already a customer.
- Search for the stock or index you want in our award-winning platform
- Choose your position and size, and your stop and limit levels
- Place the trade
- Or you can practice trading risk-free by signing up for our Demo Trading Account.
NASDAQ 100 Forecast - Key Drivers to Watch
Some of the specific themes Wall Street analysts see playing a critical role in 2026 and beyond include:
Risk management
The tech industry faces rising risks from cyber threats targeting valuable data, geopolitical instability impacting supply chains, and climate change disrupting operations. The rapid adoption of AI, often with inadequate security, further exacerbates these vulnerabilities.
Gen AI
The next advance in software development may involve autonomous gen AI agents that are able to complete complex tasks with minimal human oversight. Gen AI isn’t just transforming software creation; it’s poised to revamp the nature of software user interfaces—from forms and fields and point-and-click to conversational experiences.
Private cloud
Companies investing in data-heavy GenAI will need to control cloud costs, ensure data security, and meet regulations, especially when GenAI models use sensitive data for training. This could lead businesses to reconsider private clouds. Tech providers should offer simple hybrid cloud solutions as companies reassess their cloud strategies.
Mergers and acquisitions (M&A)
Businesses are seeking comprehensive solutions that meet diverse priorities, facing challenges like integrating complex multi-cloud infrastructures and supporting specialized processes with custom apps. To address rapidly changing customer needs, tech leaders expect a rise in high-value deals, including acquisitions, and are exploring alternatives like joint ventures and strategic partnerships to provide more robust solutions.
Tax and regulatory changes
In 2025, the tech industry will encounter challenges due to new global tax regulations, including minimum tax requirements and e-invoicing rules aimed at enhancing transparency and reducing tax evasion. Multinational tech firms will need to upgrade their enterprise resource planning (ERP) systems for better transaction recording and reporting. Additionally, companies reporting sales in a country must comply with local privacy and content regulations, highlighting the need for improved data governance.
Nasdaq-100 Price Predictions for 2026 (AI-based)
The Nasdaq 100 forecast for 2026 from algorithm-based forecasting service Wallet Investor at the time of writing indicated that the index could close 2026 at 29,995. The service’s Nasdaq 100 forecast for 2027 estimated that the index could climb to a maximum of 34,376 and end the year close to this level. Wallet Investor’s five-year projection showed the index at 43,173 points, indicating a bullish Nasdaq 100 forecast for 2030 at new all-time highs.
The Nasdaq 100 price prediction from Long Forecast Agency is very bullish, predicting that the index could close 2026 at 35,132 and trade close to 43,800 points by the end of 2027. The NASDAQ 5-year forecast is bullish, with the Tech index expected to trade as high as 60,580 points in February 2030.
A US100 forecast from Trading Economics estimated that the index could be priced at 24,422 by the end of this quarter and at 22,214 in one year.
The Gov Capital forecast for NASDAQ 100 Futures remains highly bullish, projecting prices to surpass 30,000 points by the end of 2026. Long-term outlooks extending to 2030 and beyond continue this upward trend, with predictions reaching above 40,000 points in a 7-year horizon.
Nasdaq-100 Price Predictions by Components (Top 10)
NASDAQ-100 price predictions are based on its components' price predictions, which we'll review below. The list includes 10 components sorted by each component's weight in the index.
Microsoft Corp (27%)
The 34 analysts offering 12-month price forecasts for Nasdaq 100 component Microsoft Corp have a median target of $633, with a high estimate of $700 and a low estimate of $540. The median estimate represents a +27% increase from the early 2026 prices of around $497.
The current consensus among 34 polled investment analysts is a Strong Buy for Microsoft Corp. This rating has held steady since January, when it was unchanged from a Strong Buy rating.
Apple Inc (7%)
The 35 analysts offering 12-month price forecasts for Nasdaq 100 component Apple Inc. have a median target of $289, with a high estimate of $345 and a low estimate of $225. The median estimate represents a +7% increase from the current prices of around $270.
The current consensus among 35 polled investment analysts is a Moderate Buy for Apple Inc. This rating has held steady since January, when it was unchanged from a Moderate Buy rating.
Amazon (19%)
The 42 analysts offering 12-month price forecasts for Nasdaq 100 component Amazon.com Inc have a median target of $296, with a high estimate of $340 and a low estimate of $255. The median estimate represents a +19% increase from the early 2026 prices of around $249.
The current consensus among 42 polled investment analysts is a Strong Buy for stock in Amazon.com Inc. This rating has strengthened in recent months, reflecting robust buy recommendations amid AI and AWS growth prospects.
Nvidia (36%)
The 41 analysts offering 12-month price forecasts for Nasdaq 100 component Nvidia Corp have a median target of $264, with a high estimate of $350 and a low estimate of $155. The median estimate represents a +36% increase from the mid-Q1 prices around $194.
The current consensus among 41 polled investment analysts is a Strong Buy for Nvidia Corp. This rating has held steady since January, when it was unchanged from a Strong Buy rating.
Alphabet (3%)
The 37 analysts offering 12-month price forecasts for Nasdaq 100 component Alphabet Inc. (GOOGL) have a median target of $312, with a high estimate of $350 and a low estimate of $236. The median estimate represents a +3% upside from mid-Q1 prices around $292.
The current consensus among 37 polled investment analysts is a Strong Buy for Alphabet Inc. This rating reflects 30 Buy, 7 Hold, and 0 Sell recommendations, holding steady since early January 2026.
META (30%)
The 42 analysts offering 12-month price forecasts for Nasdaq 100 component Meta Platforms Inc have a median target of $844, with a high estimate of $1,117 and a low estimate of $655. The median estimate represents a +30% increase from the mid-Q1 2026 prices of around $650.
The current consensus among 42 polled investment analysts is a Strong Buy for stock in Meta Platforms Inc. This rating has held steady since January, when it was unchanged from a Strong Buy rating.
Tesla (-8%)
The 34 analysts offering 12-month price forecasts for Nasdaq 100 component Tesla Inc have a median target of $396, with a high estimate of $800 and a low estimate of $19. The median estimate represents a -8% decrease from the current price of around $430.
The current consensus among 34 polled investment analysts is to Hold stock in Tesla Inc. This rating has held steady since January, when it was unchanged from a hold rating.
Broadcom Inc (13%)
The 30 analysts offering 12-month price forecasts for Nasdaq 100 component Broadcom Inc have a median target of $397, with a high estimate of $480 and a low estimate of $300. The median estimate represents a +13% increase from the mid-Q1 prices of around $352.
The current consensus among 30 polled investment analysts is a Strong Buy for Broadcom Inc. This rating has held steady since January, when it was unchanged from a Strong Buy rating.
Pepsico (11%)
The 13 analysts offering 12-month price forecasts for PepsiCo Inc have a median target of $158, with a high estimate of $172 and a low estimate of $142. The median estimate represents a +11% increase from the current price of around $143.
The current consensus among 13 polled investment analysts is a Moderate Buy for PepsiCo Inc. This rating comprises 5 Buy and 8 Hold recommendations, holding steady into early 2026 with recent reiterations.
Costco (19%)
The 24 analysts offering 12-month price forecasts for Nasdaq 100 component Costco Wholesale Corp have a median target of $1,092, with a high estimate of $1,218 and a low estimate of $907. The median estimate represents a +19% increase from the recent prices around $914.
The current consensus among 24 polled investment analysts is a Moderate Buy for Costco Wholesale Corp. This rating has held steady since January.
*It is worth keeping in mind that both analysts and online forecasting sites can and do get their predictions wrong. Keep in mind that past performance and forecasts are not reliable indicators of future returns. When considering Nasdaq 100 price predictions for 2026 and beyond, it’s important to keep in mind that high market volatility and the macroeconomic environment make it difficult to produce accurate long-term Nasdaq 100 analyses and estimates. As such, analysts and forecasters can get their Nasdaq 100 forecast wrong.
It is essential to do your research and always remember that your decision to trade depends on your attitude to risk, your expertise in the market, the spread of your investment portfolio, and how comfortable you feel about losing money. You should never invest money that you cannot afford to lose.
How can you trade or invest in the NASDAQ 100?
With NAGA.com, there are a number of ways to gain exposure to the NASDAQ 100 (known on our platform as the Nasdaq-100 Cash Index) – so you can choose the one that suits you best.
Trade the NASDAQ 100 index directly
With NAGA.com you can trade Nasdaq-100 (Nasdaq) Cash Index Sun-Fri: 23:01-21:10 with low fees and tight spreads.
Trade or invest in NASDAQ-100 ETFs
With NAGA.com you can trade the largest NASDAQ-100 Index ETFs, inverse and leveraged ETFs, tech and robotics ETFs, cybersecurity ETFs or AI ETFs.
Trade or invest in NASDAQ-100 stocks
With NAGA.com you can buy tech stocks outright or you can trade on their price movements without having to take ownership of shares, through CFDs.
Trade the NASDAQ 100 index directly
Trade the performance of the USA’s largest domestic and international companies from a single position. You can trade the NASDAQ 100’s price directly on the NAGA.com platform under the name ‘US Tech 100’. In other words, you’ll get direct exposure to the NASDAQ 100 index with us. It’s more liquid than trading it in other ways and you can trade it 24 hours a day, Monday to Friday.
You can trade the NASDAQ 100 on leverage using CFDs, without having to own any actual shares. Instead, you’ll put down a deposit to open a larger position, with profits and losses calculated on the full position size. This means your profits and losses can significantly outweigh your margin amount, so ensure you use risk management tools (like stop losses) when trading online.
You can go ‘long’ if you think the price will rise or ‘short’ if you think the price will fall.
Trade or invest in NASDAQ 100 ETFs
Gain broad exposure to the entire NASDAQ 100 by trading or investing in an ETF that tracks the price of the index. This means you won’t trade on the current price of the NASDAQ, but rather the ETF’s price, calculated on its net asset value (NAV).
Investing in NASDAQ ETFs is how many longer-term investors get exposure to the entire index. You can do this with share dealing. Here, you’d buy upfront, based on the full value of the ETF, and hold until you want to sell.
You could also trade NASDAQ ETFs on leverage with CFDs but bear in mind this offers lower liquidity and higher spreads than trading the index directly. Leveraged trades mean you can go long or short on NASDAQ ETFs. However, total profits or losses can significantly outweigh your margin amount, as both are based on the total position size.
With NAGA.com, you can trade the largest NASDAQ-100 Index ETFs, but also Inverse ETFs and Leveraged ETFs, Tech and Robotics ETFs, Cybersecurity ETFs, or AI ETFs.
Trade or invest in NASDAQ shares
With NAGA.com, you can also trade or invest in the actual stocks included in the NASDAQ 100.
Target specific NASDAQ 100 stocks like META (Facebook), Tesla, or Alphabet, without gaining exposure to the entire index. With this option, you choose your own NASDAQ shares based on your personal trading strategy.
Invest in stocks with zero commission charges (terms apply) on our investment platform and own actual NASDAQ 100 company shares outright.
You can also trade NASDAQ companies without having to take ownership of shares, using CFDs. Stock trading is leveraged, so you can go long or short.
Read also our monthly updates on FX, Commodities and Stock Market:
- Euro to Dollar forecast and price prediction 2026
- Pound to Dollar forecast and price prediction 2026
- USD to INR forecast 2026, 2027, 2030
- AED to INR forecast 2026, 2027, 2030
- SAR to INR forecast 2026, 2027, 2030
- Gold forecast and price prediction 2026
- Oil forecast and price prediction 2026
- Dow Jones forecast and price prediction 2026
- Natural Gas forecast and price prediction 2026
- Silver forecast and price prediction 2026
Sources:
- https://ir.nasdaq.com/financials/annual-report
- https://www.fidelity.com/learning-center/trading-investing/outlook-information-technology
- https://business.columbia.edu/insights/finance-economics/2025-stock-market-predictions
- https://www.franklintempleton.co.uk/articles/2024/equity/2025-technology-outlook-will-the-rest-of-tech-finally-catch-up-to-the-mag-7
- https://www.fitchratings.com/research/corporate-finance/us-technology-outlook-2025-neutral-outlook-across-all-subsectors-12-12-2024
- https://www2.deloitte.com/us/en/insights/industry/technology/technology-media-telecom-outlooks/technology-industry-outlook.html




The present domain / website, NAGA.eu is owned by Naga Technology GmbH, however is independently and exclusively operated by Axon Securities S.A., an AEPEY which is authorised and regulated by the Hellenic Capital Market Commission (HCMC) under licence No. 7/560/02.09.2010 and with registered address 48 Stadiou Street, 105 64 Athens, Greece.
NAGA is a trade name and trademark under the NAGA Group AG, a German based FinTech company publicly listed on the Frankfurt Stock Exchange | WKN: A161NR | ISIN: DE000A161NR7. Exclusive rights for the use of the said trade name and trademark, in the territory of Greece, are exclusively granted to Axon Securities S.A. In this respect and for the avoidance of doubt, any references in the present domain to "NAGA" refer just to the brand/trade name/trademark, the NAGA Platform or account and not to any specific company under NAGA Group of companies.
RESTRICTED JURISDICTIONS:With regards to the current website, Axon Securities S.A. offers services to Greek residents. Axon Securities S.A does not provide investment and ancillary services in the territories of third countries including Japan, Canada and the USA. For further details please refer to our Terms & Conditions.
HIGH RISK INVESTMENT WARNING:CFDs are complex instruments and come with a high risk of losing money rapidly due to leverage. Between 74-89% of retail investor accounts lose money when trading CFDs. You should consider whether you understand how CFDs work and whether you can afford to take the high risk of losing your money.
Trading through an online platform carries additional risks. Refer to our Regulation section here.