- Home
- Blog
- Forecast and Price Predictions
- Bitcoin Forecast & Price Prediction 2026: What’s next after 30% correction?
Bitcoin Forecast & Price Prediction 2026: What’s next after 30% correction?

Bitcoin's incredible journey from the 2021-2022 "crypto winter"—when BTC plummeted below $20,000, shedding 75% in 12 months—now feels like ancient history. After rising above $100,000 in 2024 and peaking near $126,000 in 2025 amid massive ETF inflows and pro-crypto U.S. policy shifts, Bitcoin entered a period of consolidation after the 30% correction from its ATH.
Analysts now forecast Bitcoin will reach new all-time highs in 2026, fueled by sustained institutional demand, discussions of nation-state adoption, Lightning Network scaling, and the lingering effects of the 2024 halving, which slashed inflation below 1% annually. Yet volatility persists, with macroeconomic headwinds, such as Fed policy, geopolitical tensions, and regulatory fine-tuning under President Trump's administration, that could trigger pullbacks, while ETF assets surpassing $250 billion and corporate treasuries, such as MicroStrategy's aggressive buying, provide strong support.
Performance hinges on liquidity flows, Trump's "Bitcoin hub" vision materializing via SEC leadership changes (Paul Atkins replacing Gary Gensler), and global blockchain utility growth.
Summary of Bitcoin Forecast & Price Predictions
- Bitcoin price prediction today: BTC/USD consolidated above the key support area (80k) and below the bullish channel broken after the Q4 2025 30% correction from $126K ATH. This short-term Bitcoin outlook is neutral, with sideways movements between 80k and 100k the most likely scenario.
- Bitcoin price prediction 2026: Consensus clusters around $120,000-$150,000 averages, with more bullish forecasts eyeing year-end peaks on institutional FOMO, U.S. strategic reserve talks, and post-halving supply squeeze, while conservatives warn of $75K-$100K if macro tightens. The chart pattern signals Bitcoin could stay under pressure into mid-2026, with a deeper correction that should offer another long-term buy-the-dip opportunity.
- Bitcoin price prediction 2026-2030: Most analysts expect crypto investors will shift focus from speculative trading to the development and adoption of blockchains and applications powered by tokens with utility and cash flows, propelling BTC toward $300K-$500K by 2030.
With NAGA, you can trade CFDs on BTC/USD and BTC/EUR with leverage, HODL Bitcoin with NO Fees* (T&Cs apply), or buy shares in a Bitcoin ETF.
Bitcoin Forecast 2026 - Fundamental analysis and market drivers
Crafting Bitcoin price predictions is inherently risky—past cycles saw 10x gains turn to 75% crashes—but 2026's outlook skews bullish amid maturing markets. Spot ETFs amassed $250B+ AUM in 2025, bridging crypto to TradFi; Trump's crypto-friendly appointees (Atkins at SEC) signal regulatory clarity; Lightning Network capacity triples to 8,000 BTC, enabling real-world payments.
Yet risks loom: Fed's cautious rate cuts, Middle East conflicts diverting risk appetite, or policy delays could extend the correction to 50% from the ATH. Historical post-halving bulls (2013, 2017, 2021) averaged 300-500% gains; 2026's maturing cycle may deliver 1.5-2x from $80K base at the beginning of the year.
Cheaper money could boost crypto
- Fed's projected 2-3 interest rate cuts in 2026 will flood markets with liquidity, which historically flows into Bitcoin, as seen with 2025's $50B ETF surge.
- BTC's sub-1% post-halving inflation crushes bonds' zero real yields, while Iran tensions drive safe-haven rotations alongside gold.
- Additionally, Trump's tax cuts could supercharge risk assets.
Trump pushes pro-crypto regulation into overdrive
- Trump's "Bitcoin hub" vision gains steam through Paul Atkins' SEC fast-tracking ETF expansions.
- Commerce and Treasury are filled with crypto advocates, plus advisory councils streamline rules. Strategic reserve proposals, with a 0.5% Treasury allocation buying around 400K BTC, should stimulate institutional FOMO.
- Rumoured Garlinghouse "crypto czar" bridges stablecoins, pulling $100B+ offshore wealth.
Portfolio asset goes mainstream
- Bitcoin's $1.8T market cap consolidates its status as one of the top 5 global assets. 2025's 13F filings reveal pensions and hedge funds allocating 1-2%, with BlackRock iShares at $50B AUM.
- Fidelity warns "no BTC equals active underweight" as $40T U.S. retirement funds eye 0.5% ($200B demand).
- Sovereign players like Norway/UAE join MicroStrategy's 300K+ BTC hoard.
Historically bullish post-halving period evolves
- The April 2024 halving slashed rewards to 3.125 BTC/block, with rewards historically peaking 12-18 months later.
- 2026 extends scarcity squeeze with 0.85% inflation vs. gold's 1.7%.
- Maturing cycles moderate prior 10x gains to 3x from $90K base—targeting $270K mathematically, while macro tailwinds provide support.
Looking at StoneX’s chart called “The Only Bitcoin Chart You'll Ever Need™”, previous Bitcoin halvings have marked the transition from the (yellow) post-bottom recovery rally stage to the (green) full-blown bull market stage that we’ve been in since April 2025.
Projecting a similar time-based cycle forward from the last halving suggests that we may have reached the peak of the current cycle at the start of Q4 2025.
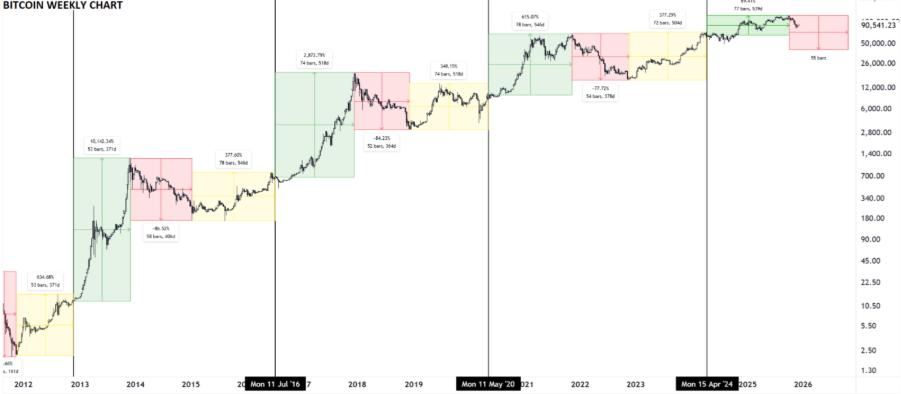
Past performance is not a reliable indicator of future results. All historical data, including but not limited to returns, volatility, and other performance metrics, should not be construed as a guarantee of future performance.
Beyond the 4-year cycle itself, the technical outlook for Bitcoin is also less bullish, if not bearish, in the medium term, raising the risk of a neutral-to-negative 2026 for the best cryptocurrency by market cap.
Learn more about Bitcoin ETFs
Bitcoin vs Gold: which asset could outperform in 2026?
Cathie Wood's making a pretty compelling pitch for Bitcoin over gold in 2026 portfolios, arguing it delivers way better returns for the risk investors take on. She notes that since 2020, Bitcoin's weekly correlation with gold has hovered around 0.14, compared to 0.27 for the usual S&P 500-bond mix that investors lean on. Even though gold crushed it with 65% gains last year while Bitcoin dipped 6%, Wood forecasts gold's run feels overblown—its market cap relative to M2 money supply hit 150%, the highest since the Depression era, which often signals stocks are about to bounce back hard.
What really sets Bitcoin apart, in Wood's view, is that built-in scarcity—its supply growth programmed to slow to 0.82% over the next couple of years, then drop to 0.41%, making every bit of new demand hit harder than with gold, where miners can just ramp up. ARK's Big Ideas for 2026 has Bitcoin's market cap potentially exploding 700% in four years to over $8 trillion, acting more like a true safe haven with a Sharpe ratio that smokes Ethereum and Solana. Lower volatility and smaller drawdowns during 2025's ups and downs just prove it's growing up from wild speculation into a legit store of value.
For anyone building portfolios, Wood's saying Bitcoin is a better pick than gold right now, with a low 0.06 correlation to bonds and only 0.28 to the S&P for real diversification that works. As global wealth keeps piling up faster than gold supply can keep pace, Bitcoin's hard cap gives it an edge; ARK even sees paths to $800K amid AI-driven productivity surges.
Gold miners might flood the market if prices stay high, watering down those gains, but what about Bitcoin? It stays pure and predictable.
Bitcoin Forecast 2026 – Technical Analysis and Chart Pattern
Looking at the weekly chart, Bitcoin’s Q4 2025 drop has done substantial technical damage. The pattern of higher highs and higher lows (the textbook definition of an uptrend) started in 2023 is broken and tested at $100K, fading hopes for a rally to new highs in 2026.
That said, Bitcoin has broken below its 50-week EMA for the first time in years, and this confluence (MA, the broken trendline, and 23.6% Fibonacci retracement) acts as a key resistance, while the key support level is the 80k-85k area, the previous swing low, and 38.2% Fib retracement.
The price is caught between these key support and resistance levels, suggesting the intermediate trend countertrend may continue towards the 70k-71k area.
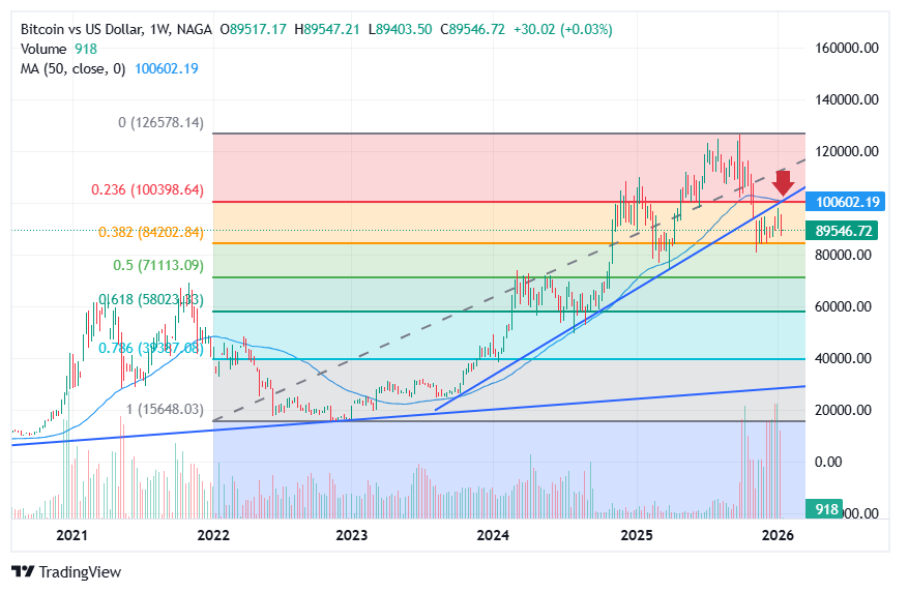
Past performance is not a reliable indicator of future results. All historical data, including but not limited to returns, volatility, and other performance metrics, should not be construed as a guarantee of future performance.
If the short-term upward movement fails below the 100k level, the $80K level will come under pressure, setting the stage for a deeper pullback with the bottom of that range sitting at $53K-57K.
Bitcoin's chart pattern
From the 2022 lows at $16.5K to the 2025 peak at ~$126K, Bitcoin completed a five-wave rally. If that’s correct, the end of 2025 pullback from ATH could be the start of a longer correction.
In Elliott Wave terms, these corrections usually play out in three stages: a first drop [A], a bounce [B], then a deeper pullback [C]. If this pattern continues, Bitcoin could stay under pressure into mid-2026. Key price zones to watch on the way down include $84K-to-80K, the $70K area, and $58K-to-55K, where past cycles have found support.
Looking at the long-term Bitcoin chart pattern, either the A-B-C correction is completed, and a new leg up will develop, or a larger 5 waves pattern of wave A is developing. In this case, the bounce from support is wave 4, and a decline below $80k will complete corrective wave A.
Learn more about technical trading indicators
Institutional Bitcoin Price Predictions 2026
While some analysts forecast Bitcoin to reach $50,000 by the end of 2026, others peg it at around $100,000. Such predictions of bitcoin prices have been made many times in the past, but seemed too ambitious. With Bitcoin surging below $100,000 and a more mature market, conservative Bitcoin price predictions are more realistic for 2026 and the next 5 years.
Institution 2026 Target Key Drivers Key Risks CoinShares $100K-$175K ETF inflows to $300B AUM, Atkins SEC regs, Lightning scaling Policy delays, reserve implementation lag Galaxy Digital
$200K ETFs $250B+, 5 Nasdaq corps/5 nations adopt BTC treasuries Macro tightening, altcoin competition JP Morgan $160K Lightning Network 3x to 8K BTC, post-halving scarcity Exchange hacks, regulatory reversals Bloomberg Intelligence $150K 20% gold mcap ($15T), ETF quarterly $50B+ Fed hawkishness, yield competition VanEck $180K 10% $12T offshore wealth, tokenized assets/DeFi Geopolitical risk-off, volatility spikes Standard Chartered $150K (revised) MicroStrategy 500K+ BTC, pension 0.5-1% allocation ETF saturation, halving euphoria fade Fundstrat $250K Treasury 0.5% ($425K BTC = 85% supply), corporate FOMO Rate cut delays, Middle East tensions Bitwise $200K Sovereign wealth funds (Norway/UAE), retirement inflows China crypto bans, dollar strength Fidelity $175K "No BTC = underweight" thesis, 2% institutional average Quantum computing threats (long-term Bernstein $220K BlackRock iShares $100B AUM, Lightning payments mainstream Leverage unwinds, whale dumps Table with 2026 Bitcoin Price Forecasts: Detailed Institutional Views
CoinShares: $100K-$175K
CoinShares projects Bitcoin trading between $100,000 and $175,000 in 2026, balancing U.S. regulatory tailwinds from Trump's pro-crypto appointees, such as Paul Atkins at the SEC, against risks of policy delays or underwhelming implementation of the strategic reserve. The firm highlights institutional ETF inflows potentially hitting $300B in AUM as BlackRock and Fidelity deepen allocations, while Lightning Network scaling absorbs volatility; long-term, $250K emerges at 25% of gold's market cap, though 2026 timing hinges on offshore wealth inflows and the pace of global adoption.
Galaxy Digital: $200K
Galaxy Digital forecasts Bitcoin reaching $200,000 by Q4 2026, propelled by spot ETFs surpassing $250 billion in assets under management as five Nasdaq 100 companies and five nation-states add BTC to balance sheets or sovereign funds. CEO Mike Novogratz emphasizes Bitcoin's dominance, reclaiming 55-60% and outpacing altcoins amid corporate treasuries like MicroStrategy scaling to 500K+ BTC; post-halving scarcity and Trump's "Bitcoin hub" vision amplify FOMO, with U.S. retirement funds allocating 0.5-1% ($200-400B potential).
JP Morgan: $160K
JP Morgan analysts predict $160,000 by the end of 2026, assuming Lightning Network capacity triples to 8,000 BTC daily—enabling seamless micropayments and real-world utility that draws retail/institutional users. The bank factors ETF stability post-2025 correction, Fed rate cuts boosting risk appetite, and regulatory clarity reducing exchange risks; BTC's fixed 21M supply contrasts fiat debasement, positioning it as "digital gold 2.0" with volatility damping via Layer 2 scaling.
Bloomberg Intelligence: $150K
Bloomberg Intelligence sees $150,000 as Bitcoin captures 20% of gold's $15T market cap, driven by sustained ETF inflows ($50B+ quarterly) and sovereign interest mirroring MicroStrategy's playbook. Mike McGlone notes BTC's resilience in risk-off (above 50-week MA), with 2024 halving effects peaking mid-2026; geopolitical hedges favor scarcity amid dollar weakness, though Fed hawkishness caps upside if yields spike.
VanEck: $180K
VanEck targets $180,000 via 10% penetration of the $12 trillion offshore wealth market, as Paul's Atkins' SEC greenlights more ETPs and Trump's tsar streamlines stablecoin-BTC bridges. The firm highlights a shift in blockchain utility—tokenised assets, DeFi yield—drawing pensions; the 2026 cycle extends the 2025 bull, with a $90K correction as the optimal dip-buy per seasonality.
Standard Chartered: $150K (Revised from $200K+)
Standard Chartered slashed to $150,000 after 2025's $126K peak, citing ETF saturation (683K BTC held) but sustained MicroStrategy buys and pension allocations from $40T U.S. pool. Compared with gold ETF launches, they eye steady inflows minus halving euphoria; U.S. reserves (1% Treasury = $200B) remain a wildcard, with volatility from macro (rates, wars).
Fundstrat: $250K
Fundstrat's $250,000 call rests on a halving supply shock and the U.S. Treasury allocating 0.5% of reserves (425K BTC = 85% of annual supply), igniting global FOMO. Tom Lee flags corporate/nation-state treasuries (10+ entities by mid-year), ETF AUM doubling to $500B; post-correction $90K base mirrors 2021 setup for 3x rally.
Bitwise: $200K
Bitwise forecasts $200K as sovereign wealth funds (Norway Oil Fund, UAE) follow U.S. reserve talks, with retirement inflows hitting $100B via ETFs. They emphasize BTC dominance >60% post-altcoin shakeout and Lightning adoption for remittances; the base case assumes 2-3 Fed cuts, maintaining risk-on.
Fidelity: $175K
Fidelity's $175K target stems from "no BTC allocation = active underweight" realization, pushing 2% average institutional exposure ($400B+ demand). Digital asset heads notes maturing cycles deliver steady 2x gains; regulatory clarity + scarcity = a portfolio staple rivalling gold.
Bernstein: $220K
Bernstein eyes $220K, with BlackRock iShares hitting $100B in AUM alone, and Lightning enabling mainstream payments (1M+ daily users). They project 15% offshore money rotation, corporate adoption wave; $90K dip = generational buy.
Gold Forecast & Price Prediction 2026
AI Bitcoin price predictions 2026
Trading Economics forecasts Bitcoin to be priced at 97,528 by the end of this quarter, and at $106,697 in one year, according to its global macro model's projections and analysts' expectations. Wallet Investor provides a slightly bullish Bitcoin price prediction for 2026. The website forecasts Bitcoin at $124,350 by the end of the year. The website forecasts Bitcoin to trade at $127,680 within 1 year. According to Coin Price Forecast, Bitcoin price will hit $116,732 by the end of 2026, with $111,034 by the end of Q2, while Long Forecast predicts Bitcoin to trade as high as $91,103 by the end of 2026.
Bitcoin Price Prediction 2026-2030
Bitcoin price prediction from Cathie Wood (CEO of Ark Invest) - $1.0M
Cathie Wood of ARK Invest predicts Bitcoin could reach $$1,0M by 2030, arguing that broader economic factors are shifting in favor of risk assets and that the current cycle has been exceptionally mild.
This outrageous Bitcoin price prediction entails a crypto market cap representing a large portion of a projected $25 trillion total crypto market, emphasizing Bitcoin’s role as a unique global digital monetary system.
Mike McGlone, senior commodity strategist at Bloomberg Intelligence, said that limited supply and rising demand would suggest a bullish bitcoin projection. The analyst's Bitcoin price prediction for 2030 is $100,000.
Arthur Hayes predicts a significant surge in Bitcoin’s value, with a long-term projection of $750,000 to $1 million by 2026. In his recent interview, Hayes pointed to Bitcoin’s limited supply, the introduction of Bitcoin spot ETFs in regulated markets, and geopolitical uncertainties as significant factors driving this anticipated growth.
Renowned bitcoin analyst PlanB predicts a potential all-time high of $524,000 for bitcoin in the next four years.
Analysts at Blockware Solutions suggest that the 2024 bitcoin halving could propel the price to a staggering $400,000 in the next 5 years.
Mike Novogratz, a prominent Bitcoin advocate and CEO of Galaxy Digital, has significantly revised his earlier bullish predictions for Bitcoin. In 2021, he had anticipated Bitcoin reaching $500,000 by 2024, even planning a commemorative tattoo for the milestone. Novogratz maintains a long-term optimistic view, believing Bitcoin will eventually hit $500,000, though not within the next five years.
His current ultra-bullish Bitcoin price prediction is influenced by Federal Reserve Chair Jerome Powell’s firm stance on interest rates, which Novogratz has forecasted as a barrier to a rapid return to BTC’s previous highs.
Mark Basa gave a more bullish Bitcoin price prediction for 2030 and beyond. He expected the token to reach $1m in the next eight years. He believes that a whole new generation of young people is going to be introduced to easier ways to buy Bitcoin and interact with crypto. They’ll be faced with a much higher cost of living, US debt, inflation, and a housing market almost out of reach.
The most bullish 2030 Bitcoin price prediction comes from Cathie Wood of ARK Invest. She forecasts Bitcoin will hit $1.0 million by 2030.
The Bitcoin price prediction for the next 5 years from WalletInvestor is bullish, with BTC forecasted to trade around 266,773 USD.
Giving longer-term price targets for bitcoin in 2030, DigitalCoinPrice, as of January 2026, suggested that the coin could trade at an average price of $271,622 in 2030.
According to PricePrediction, Bitcoin could reach a maximum value of $638,869 with an average trading price of $546,474 throughout 2030.
According to CoinPriceForecast, Bitcoin price will hit $128,346 by the end of 2027. Bitcoin will rise from $194,498 to $257,864 during 2031-2037. This is one of the most bullish Bitcoin forecasts for the next 10 years.
Is It Possible to Forecast the Price of Bitcoin?
Many price predictions for Bitcoin are flawed because they lack the necessary analytical support. Investors will always be attracted to a high price point, especially one that is on an upward price trend. Someone holding a cryptocurrency priced at $0.01 could easily believe that it will rise to $10,000 just because it sounds good.
The problem is that predictions can be made without any evidence or analysis. However, three types of analysis have been used in the financial world for a long time, trying to forecast prices and the evolution of markets.
- Technical Analysis
- Fundamental Analysis
- Sentimental Analysis
Bitcoin Forecast using fundamentals
Investors in financial markets use fundamental analysis to study and evaluate the variables that impact an asset’s price.
You can assess the intrinsic value of a cryptocurrency to determine if it is undervalued or overvalued. This can be achieved by analyzing qualitative factors like the state of the economy and cryptocurrency market conditions, as well as the management and market capitalization of crypto companies.
Fundamental analysis can help traders determine the price of a cryptocurrency based on a wide range of information. This could be a great way to make long-term investment decisions.
How to conduct a Bitcoin price prediction today using fundamentals
Fundamental analysis is when you examine the fundamentals of cryptocurrency projects, from their market capitalization to the utility and value of the native token.
Do not confuse fundamental analysis and technical analysis. Fundamental analyses of cryptos are more qualitative and less tangible than statistical trends like price charts or historical market data.
The fundamental analysis of cryptocurrency is like that of traditional financial markets, with more traditional assets such as stocks. It is not as important to focus on a company’s historical financial performance, financial statements, or balance sheets.
The following parameters can be used to help investors predict trends in crypto markets:
- Market capitalization
- Total and circulating supply
- Token utility and use cases
- Community size
- The team for the crypto project
- The crypto's trading volume
- Crypto exchanges' listings
- Partnerships with trusted institutions
- The latest news about the coin
- Government rules and regulations
It is important to remember that fundamental analysis can only give you an overview of cryptocurrency investments. You can better understand the project and the future changes in cryptocurrency prices by looking at all the information. To get a better picture, you can also refer to the company’s whitepaper.
You can also examine blockchain metrics, which provide crucial information about a cryptocurrency's technology and processes.
Bitcoin Forecast using technical analysis
Technical analysis uses historical price charts and market statistics to examine and anticipate price changes in the financial markets. It is founded on the concept that if a trader can recognize historical market trends, they may anticipate future price trajectories accurately.
Whereas fundamental analysis focuses on an asset's 'real value,' considering both external and intrinsic elements, technical analysis is only based on an asset's price charts. To anticipate future movements, all that is required is the recognition of patterns on a chart.
The ability to recognize price trend cues in a market is an important part of any trading strategy. All traders must devise a strategy for determining the optimal entry and exit points in a market, and using technical analysis tools is a popular technique for doing so.
Technical analysis software is now so widely utilized that many people believe it has established self-fulfilling trading rules: As more traders use the same indicators to find support and resistance levels, more buyers and sellers will congregate around the same price points, repeating the patterns.
In general, technical analysts look at the following broad types of indicators, formations, and theories:
- Price trends (trendlines, channels, Elliott Waves, Dow Theory)
- Chart patterns (double tops and bottoms, head and shoulders, triangles, wedges)
- Price action (pin bar, inside and outside bars, and different candlestick chart patterns like Doji candle)
- Trend following indicators (moving averages, Ichimoku, Parabolic SAR, ZigZag, ADX)
- Volatility indicators (Bollinger bands, ATR)
- Oscillators (RSI, MACD, CCI, Stochastic)
- Support and resistance levels (Fibonacci retracements, pivot points)
Visit NAGA Academy to learn more
Bitcoin Price Prediction Using Market Sentiments
In finance, the term "sentiment" refers to a viewpoint or opinion about a market's condition. The sentiment of crypto market investors towards the asset is a description of their general emotions and attitudes. It reflects the collective psychology of all those involved in trading and developing cryptocurrency.
How investors feel about cryptocurrency can have a tangible impact on market cycles and the price. It can have serious implications if enough traders act on the ideas, thoughts, and feelings they share, regardless of whether they are based on real-world data. This is evident in how tweets by Elon Musk have impacted Bitcoin's price (a bullish sentiment).
For analyzing the sentiment of cryptocurrency markets, there are many statistics you can use. The following statistics provide vital information about the movement and trajectory of cryptocurrency assets: funding rates, sentiment indices, social media, community analysis, and whale monitoring.
The funding rates are the monthly payments that traders receive based on price differences between the spot price of currencies and tokens and the price difference between cryptocurrency perpetual contracts. Positive funding rates indicate a bullish market.
A sentiment index is used to predict whether investors will act fearfully or greedily. It can be affected by volatility, market momentum, and investor responses to surveys. A fearful market can be an opportunity to buy if it is managed correctly. Conversely, a greedy market means that it is a good moment to sell.
Another crucial aspect for assessing sentiment in crypto markets is the community’s activity on social media, especially Twitter and Telegram. Investors would look for an active social network with meaningful interaction across platforms.
Whale monitoring is the process of keeping an eye out for big crypto players. A cryptocurrency whale is an investor who holds large-value transactions on multiple blockchains. Whale watchers spot major market participants' trades and trade accordingly.
Bitcoin Historical Prices
To better inform your Bitcoin price predictions, here are the most important price movements and trends in Bitcoin's history.
2009 - 2015
Bitcoin was first introduced in 2009. Back then, the price of BTC was zero. Its price reached $0.09 on July 17, 2010. In April 2011, the price was around $1 and surged to around $29.60 by June 2011, which was a 2,960% growth in only three months. Its price dropped to $2 by November 2011.
Bitcoin had a steady evolution throughout 2012, and by 2013 it surged again, reaching $230 by April and then $1,237 in October 2013. However, the Bitcoin price plummeted by 2014, and it was around $300 by the start of 2015.
2016-2022
The price of Bitcoin steadily climbed through 2016, reaching $900 by December 2016. In December 2017, Bitcoin's price reached $19,345.49, gaining massive social media attention. Major investors took notice of Bitcoin, and the cryptocurrency market exploded.
The price of Bitcoin fluctuated over the next two years, with only small spikes in price. In June 2019, prices surpassed $10,000, indicating a rebound in both price and trading volume. It dropped to $6,635.84 in December 2019.
The COVID-19 pandemic caused the economy to shut down in 2020. However, Bitcoin's price surged into activity again. Bitcoin’s price was around $7,000 at the beginning of 2020. Then the price of the asset was accelerated by the pandemic shutdown and subsequent government policy. And they were right, as the price did increase aboutby 416% by the end of the year, reaching $29,000 in December 2020.
It took Bitcoin less than a month to surpass its 2020 price record of $40,000, which happened in January 2021. Prices fell by half in the summer of 2021. Bitcoin’s price reached its lowest point on July 19, when it was trading at $29,795.55.
But the crypto market experienced another bull market during October and November, and Bitcoin reached an all-time record of $67,549.14 on November 7, 2021.
Bitcoin failed to break the $70,000 level and started dropping in late 2021. The cryptocurrency has slipped into a bear market since November 2021, recording one of its biggest historical crashes in 2022, driven by the collapse of high-profile projects, liquidity issues, and bankruptcies.
By the end of 2022, the cryptocurrency crashed below $20,000 for the first time since 2020, fueling extreme fear in the market. In December 2022, Bitcoin was struggling to maintain at $17,000.
2023 - 2026
In 2023, FTX founder Sam Bankman-Fried was found guilty of all seven criminal counts brought against him by federal prosecutors in the U.S.
Also in 2023, Binance’s Changpeng Zhao pleaded guilty to criminal charges and stepped down as the company’s CEO as part of a $4.3 billion settlement with the Department of Justice.
However, Bitcoin had a huge rally in 2023, with the digital currency up some 152% for the year.
At least some of this success can be chalked up to an improving overall economy; job gains, the deceleration of inflation, and the prospect of interest rate cuts this year have helped to bolster stocks, which have been shown to follow similar price patterns as cryptocurrencies.
The expected Bitcoin halving and Bitcoin ETF added optimism to the market, with BTC/USD trading at a new all-time high above $73,000 in March 2024, as funds poured into ETFs.
Bitcoin soared past $100,000 for the first time following the election of crypto-friendly President Donald Trump and entered a correction phase during Q1 2025. The price rebounded to $125,500 by the end of Q3 2025, when it entered a new corrective wave, reaching a local low of $80,700 in November 2025. As of 23 January 2026, Bitcoin was trading around $90,000.
Sources:
- https://www.bitcoin.com/get-started
- https://www.federalreserve.gov/econres/feds/bitcoin-technical-background-and-data-analysis.htm
- https://www.coinglass.com/BitcoinOpenInterest
- https://www.investopedia.com/what-to-expect-from-bitcoin-and-crypto-markets-in-2025-8750171
- https://www.investopedia.com/where-analysts-think-bitcoin-is-headed-in-2025-update-8762665
- https://cointelegraph.com/news/bitcoin-hash-rate-decline-post-halving-implications-strategies
- https://www.morningstar.co.uk/uk/news/258219/what-to-expect-from-bitcoin-in-2025.aspx


The present domain / website, NAGA.eu is owned by Naga Technology GmbH, however is independently and exclusively operated by Axon Securities S.A., an AEPEY which is authorised and regulated by the Hellenic Capital Market Commission (HCMC) under licence No. 7/560/02.09.2010 and with registered address 48 Stadiou Street, 105 64 Athens, Greece.
NAGA is a trade name and trademark under the NAGA Group AG, a German based FinTech company publicly listed on the Frankfurt Stock Exchange | WKN: A161NR | ISIN: DE000A161NR7. Exclusive rights for the use of the said trade name and trademark, in the territory of Greece, are exclusively granted to Axon Securities S.A. In this respect and for the avoidance of doubt, any references in the present domain to "NAGA" refer just to the brand/trade name/trademark, the NAGA Platform or account and not to any specific company under NAGA Group of companies.
RESTRICTED JURISDICTIONS:With regards to the current website, Axon Securities S.A. offers services to Greek residents. Axon Securities S.A does not provide investment and ancillary services in the territories of third countries including Japan, Canada and the USA. For further details please refer to our Terms & Conditions.
HIGH RISK INVESTMENT WARNING:CFDs are complex instruments and come with a high risk of losing money rapidly due to leverage. Between 74-89% of retail investor accounts lose money when trading CFDs. You should consider whether you understand how CFDs work and whether you can afford to take the high risk of losing your money.
Trading through an online platform carries additional risks. Refer to our Regulation section here.